Difference between revisions of "Main Page/Featured article of the week/2017"
Shawndouglas (talk | contribs) (Added last week's article of the week.) |
Shawndouglas (talk | contribs) m (Text replacement - "\[\[Satya Sistemas Ltda.(.*)" to "[[Vendor:Satya Sistemas Ltda.$1") |
||
| (30 intermediate revisions by the same user not shown) | |||
| Line 1: | Line 1: | ||
{{ombox | {{ombox | ||
| type = notice | | type = notice | ||
| text = If you're looking for other "Article of the Week" archives: [[Main Page/Featured article of the week/2014|2014]] - [[Main Page/Featured article of the week/2015|2015]] - [[Main Page/Featured article of the week/2016|2016]] - 2017 | | text = If you're looking for other "Article of the Week" archives: [[Main Page/Featured article of the week/2014|2014]] - [[Main Page/Featured article of the week/2015|2015]] - [[Main Page/Featured article of the week/2016|2016]] - 2017 - [[Main Page/Featured article of the week/2018|2018]] - [[Main Page/Featured article of the week/2019|2019]] - [[Main Page/Featured article of the week/2020|2020]] - [[Main Page/Featured article of the week/2021|2021]] - [[Main Page/Featured article of the week/2022|2022]] - [[Main Page/Featured article of the week/2023|2023]] - [[Main Page/Featured article of the week/2024|2024]] | ||
}} | }} | ||
| Line 17: | Line 17: | ||
<!-- Below this line begin pasting previous news --> | <!-- Below this line begin pasting previous news --> | ||
<h2 style="font-size:105%; font-weight:bold; text-align:left; color:#000; padding:0.2em 0.4em; width:50%;">Featured article of the week: July 17–23:</h2> | <h2 style="font-size:105%; font-weight:bold; text-align:left; color:#000; padding:0.2em 0.4em; width:50%;">Featured article of the week: December 25–31:</h2> | ||
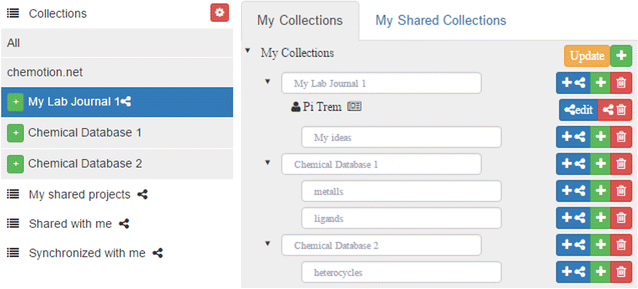
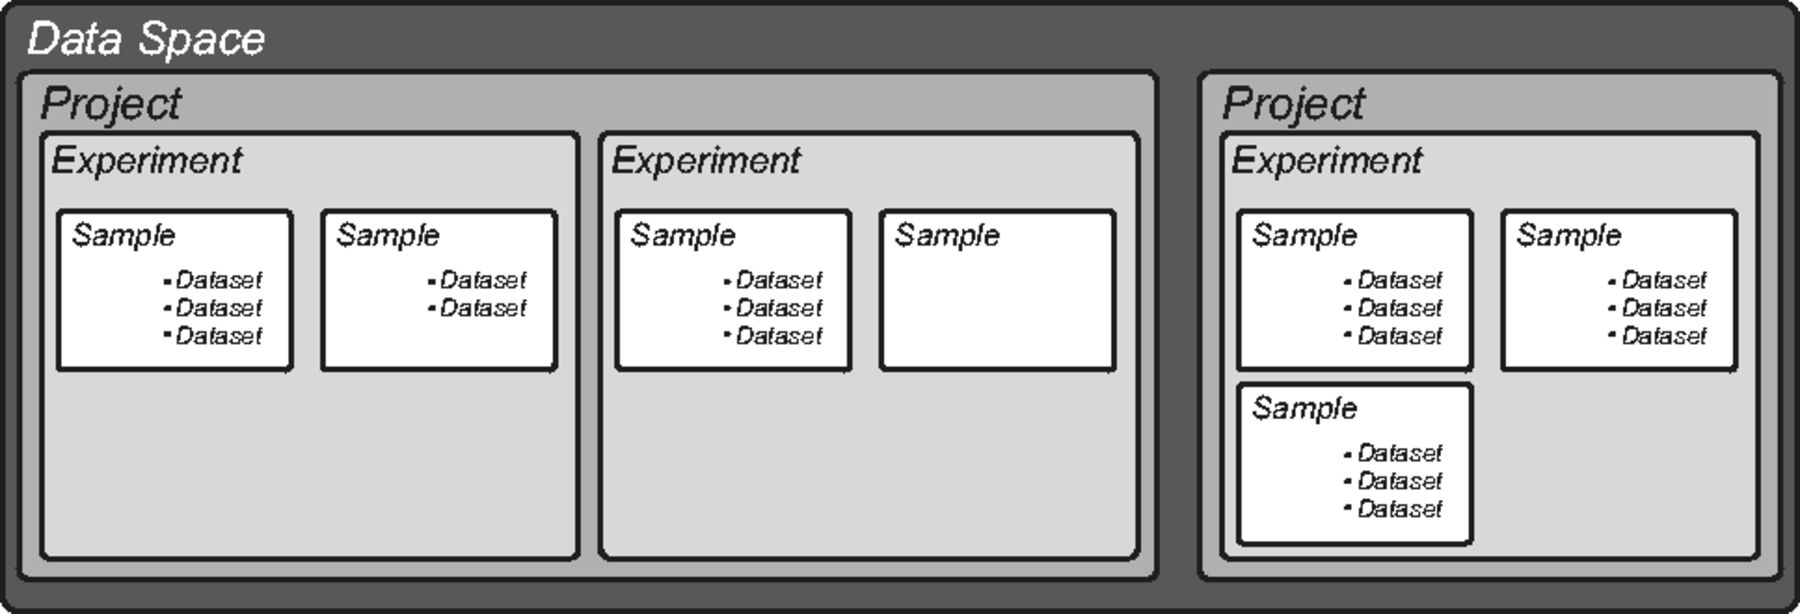
<div style="float: left; margin: 0.5em 0.9em 0.4em 0em;">[[File:Fig2 Tremouilhac JOfChemoinfo2017 9.gif|240px]]</div> | |||
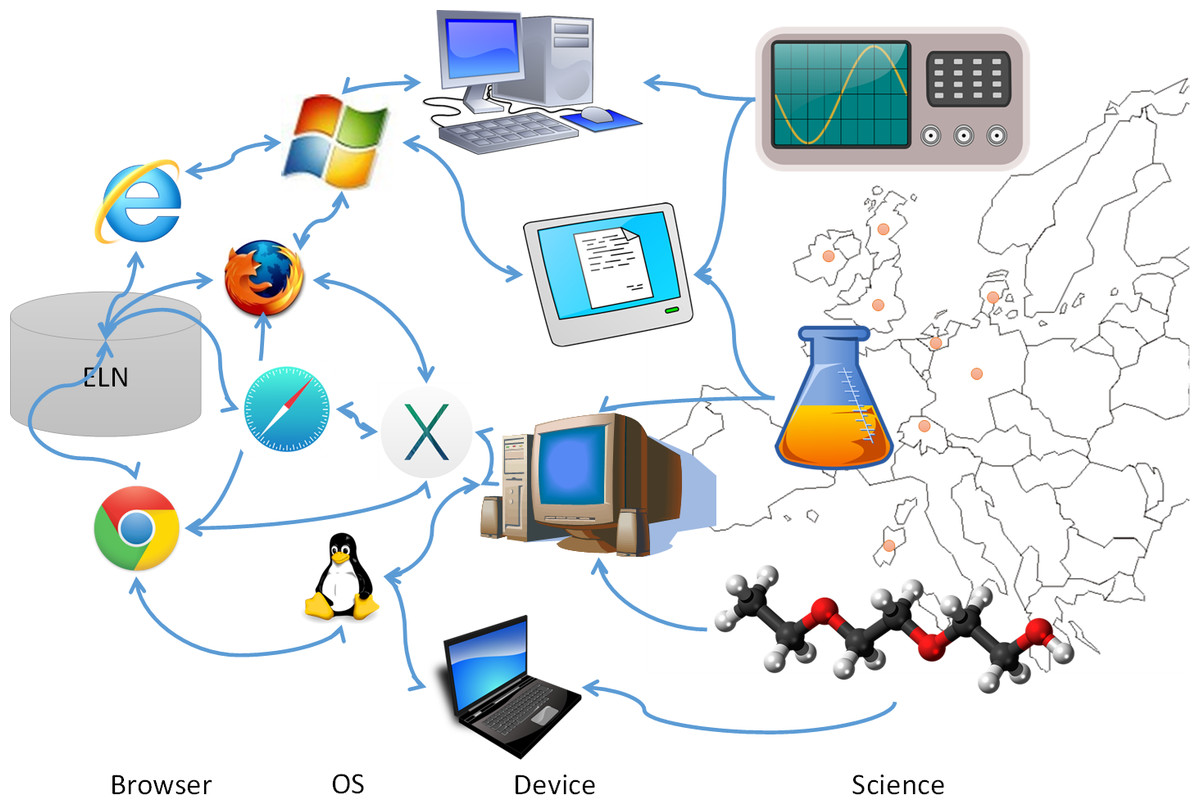
'''"[[Journal:Chemotion ELN: An open-source electronic lab notebook for chemists in academia|Chemotion ELN: An open-source electronic lab notebook for chemists in academia]]"''' | |||
The development of an [[electronic laboratory notebook]] (ELN) for researchers working in the field of chemical sciences is presented. The web-based application is available as open-source software that offers modern solutions for chemical researchers. The [[Chemotion ELN]] is equipped with the basic functionalities necessary for the acquisition and processing of chemical data, in particular work with molecular structures and calculations based on molecular properties. The ELN supports planning, description, storage, and management for the routine work of organic chemists. It also provides tools for communicating and sharing the recorded research data among colleagues. Meeting the requirements of a state-of-the-art research infrastructure, the ELN allows the search for molecules and reactions not only within the user’s data but also in conventional external sources as provided by SciFinder and PubChem. The presented development makes allowance for the growing dependency of scientific activity on the availability of digital [[information]] by providing open- source instruments to record and reuse research data. The current version of the ELN has been used for over half of a year in our chemistry research group, serving as a common infrastructure for chemistry research and enabling chemistry researchers to build their own databases of digital information as a prerequisite for the detailed, systematic investigation and evaluation of chemical reactions and mechanisms. ('''[[Journal:Chemotion ELN: An open-source electronic lab notebook for chemists in academia|Full article...]]''')<br /> | |||
|- | |||
|<br /><h2 style="font-size:105%; font-weight:bold; text-align:left; color:#000; padding:0.2em 0.4em; width:50%;">Featured article of the week: December 18–24:</h2> | |||
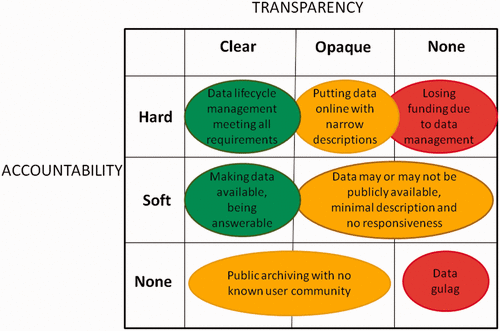
<div style="float: left; margin: 0.5em 0.9em 0.4em 0em;">[[File:Fig1 Mayernik BigDataSoc2017 4-2.gif|240px]]</div> | |||
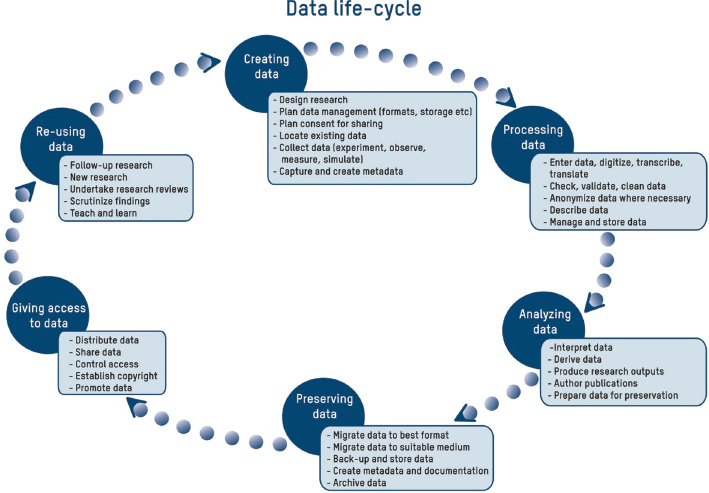
'''"[[Journal:Open data: Accountability and transparency|Open data: Accountability and transparency]]"''' | |||
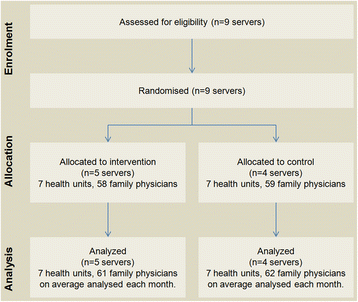
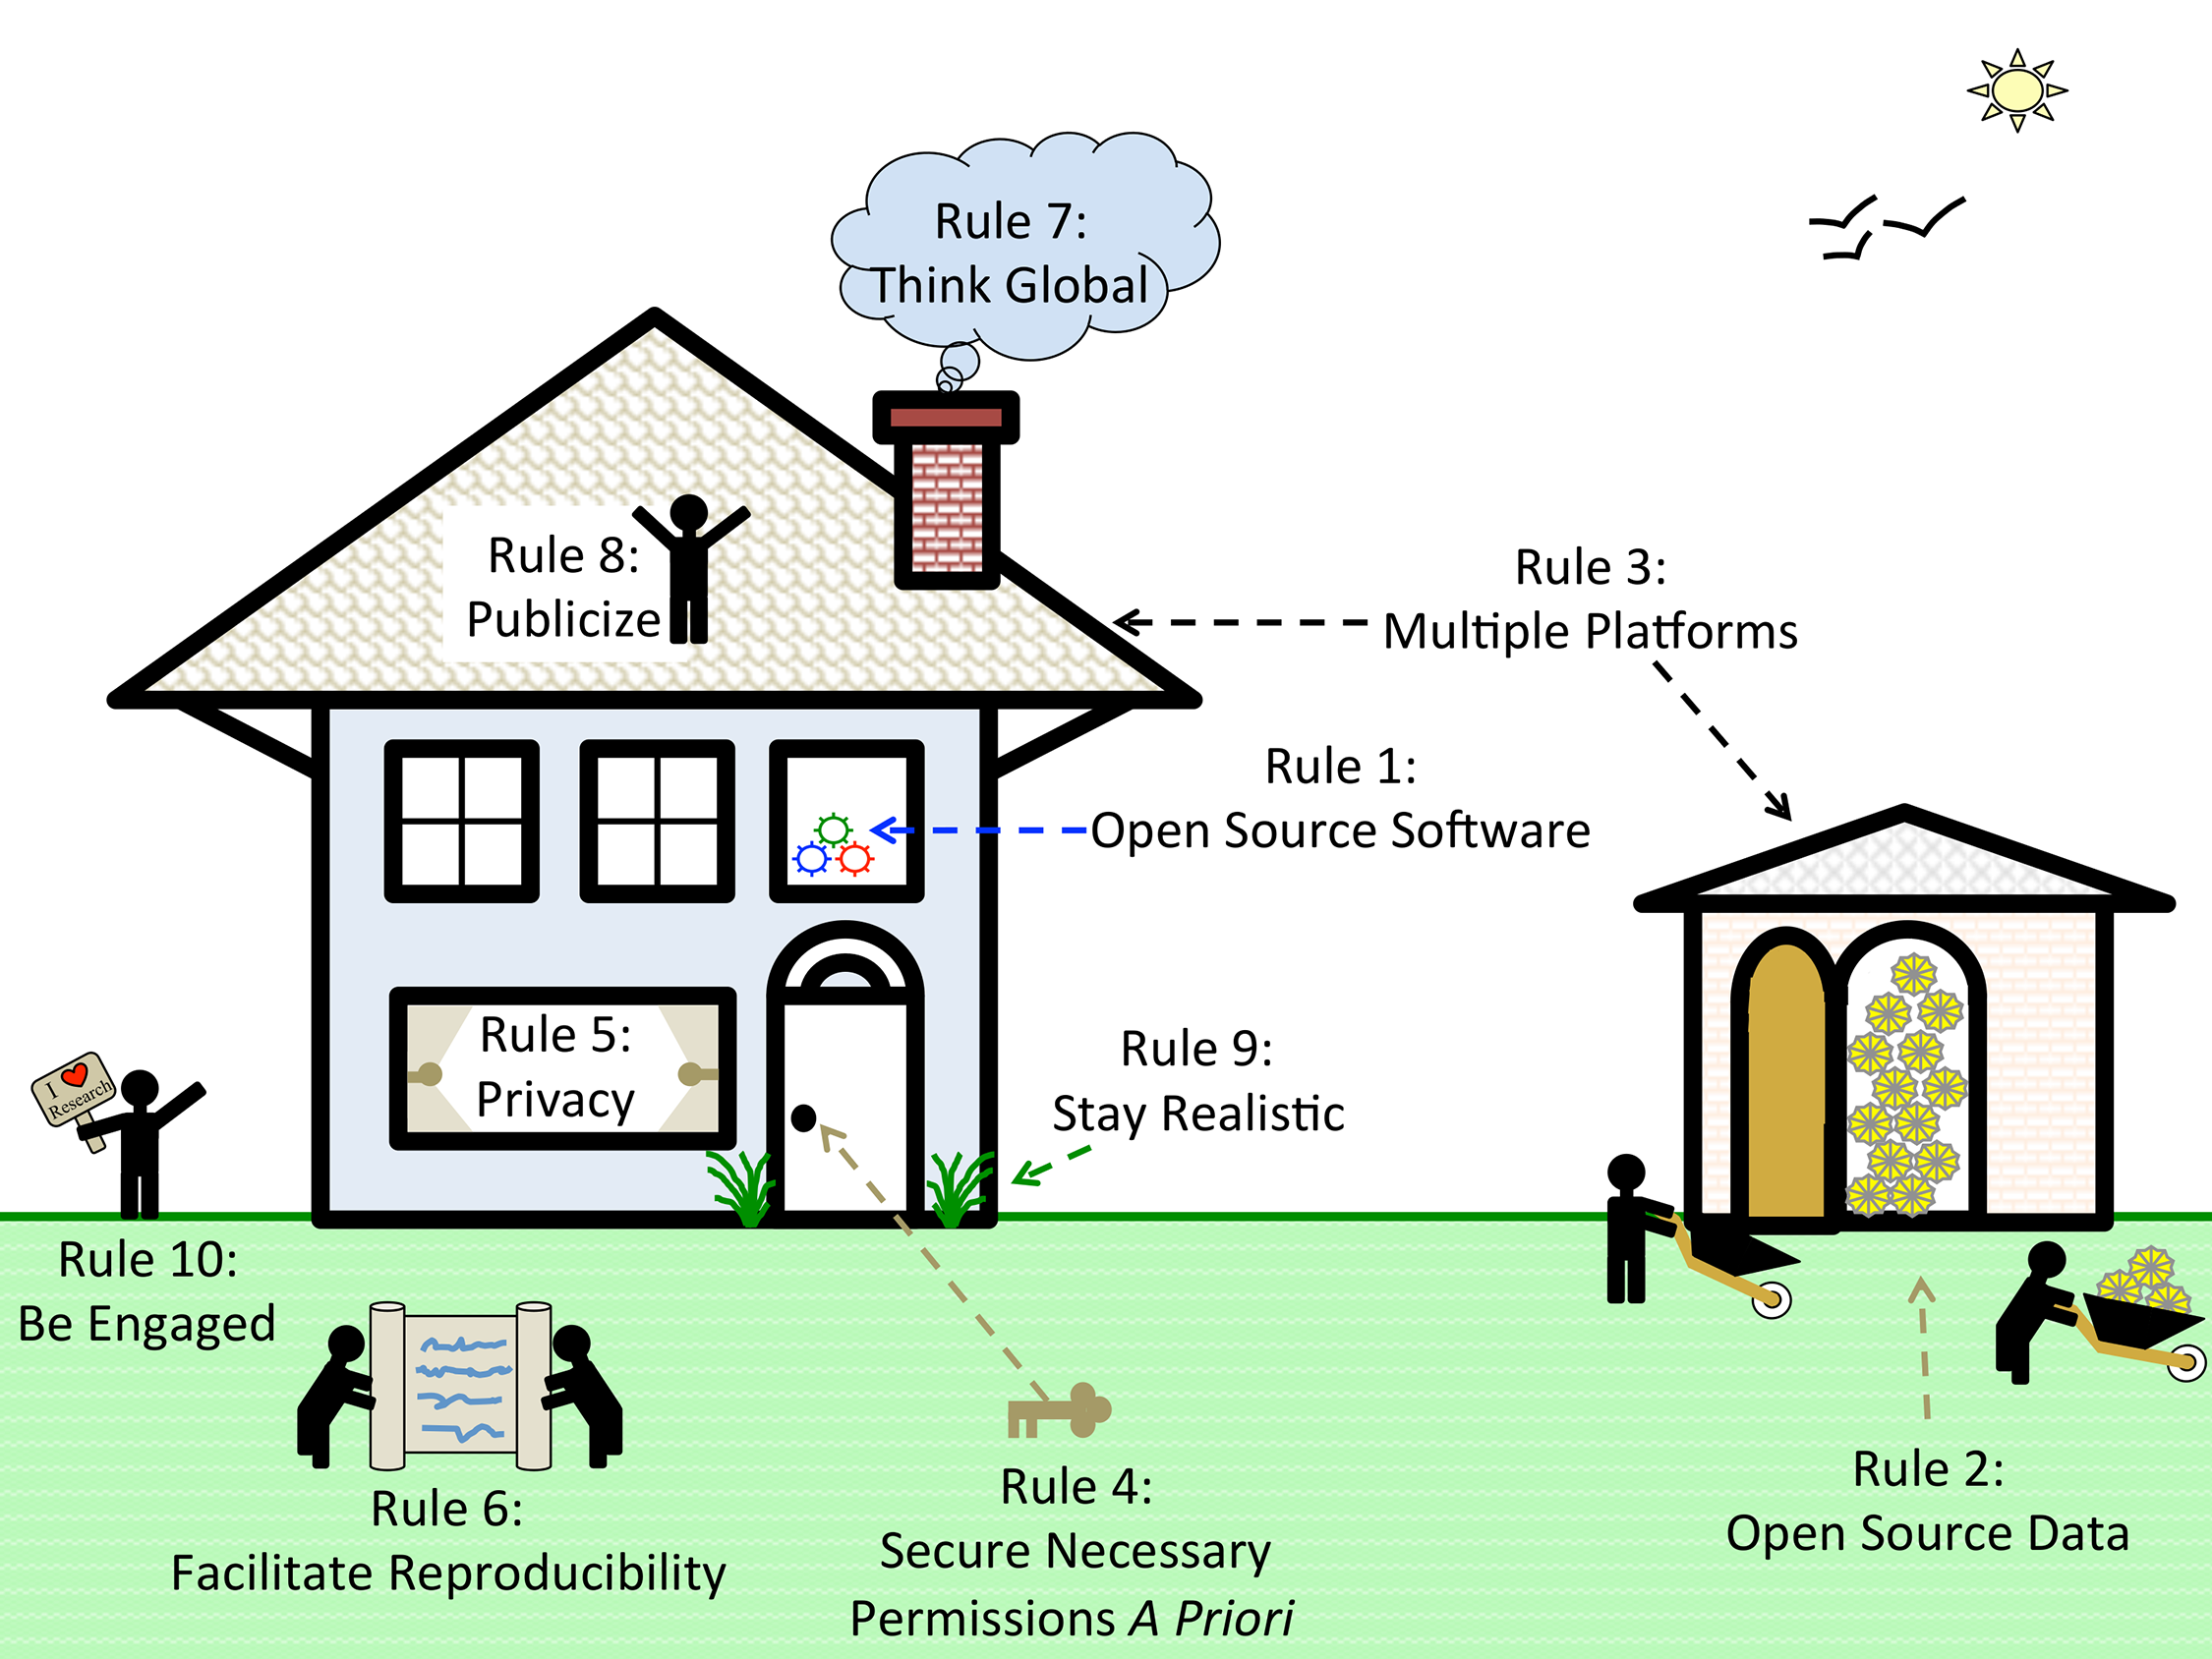
The movements by national governments, funding agencies, universities, and research communities toward “open data” face many difficult challenges. In high-level visions of open data, researchers’ data and metadata practices are expected to be robust and structured. The integration of the internet into scientific institutions amplifies these expectations. When examined critically, however, the data and metadata practices of scholarly researchers often appear incomplete or deficient. The concepts of “accountability” and “transparency” provide insight in understanding these perceived gaps. Researchers’ primary accountabilities are related to meeting the expectations of research competency, not to external standards of data deposition or metadata creation. Likewise, making data open in a transparent way can involve a significant investment of time and resources with no obvious benefits. This paper uses differing notions of accountability and transparency to conceptualize “open data” as the result of ongoing achievements, not one-time acts. ('''[[Journal:Open data: Accountability and transparency|Full article...]]''')<br /> | |||
|- | |||
|<br /><h2 style="font-size:105%; font-weight:bold; text-align:left; color:#000; padding:0.2em 0.4em; width:50%;">Featured article of the week: December 11–17:</h2> | |||
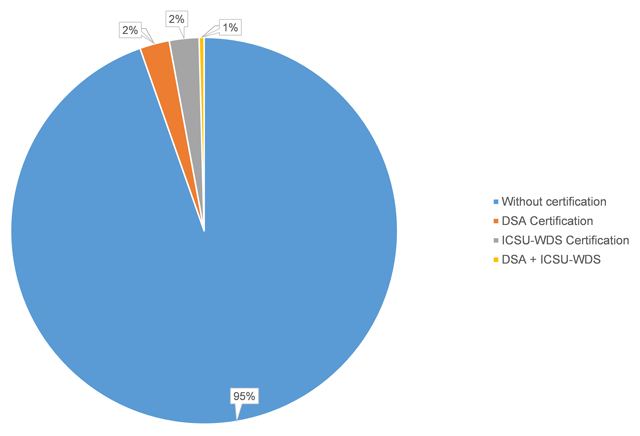
<div style="float: left; margin: 0.5em 0.9em 0.4em 0em;">[[File:Fig3 Husen DataSciJourn2017 16-1.png|240px]]</div> | |||
'''"[[Journal:Recommended versus certified repositories: Mind the gap|Recommended versus certified repositories: Mind the gap]]"''' | |||
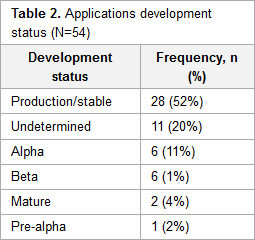
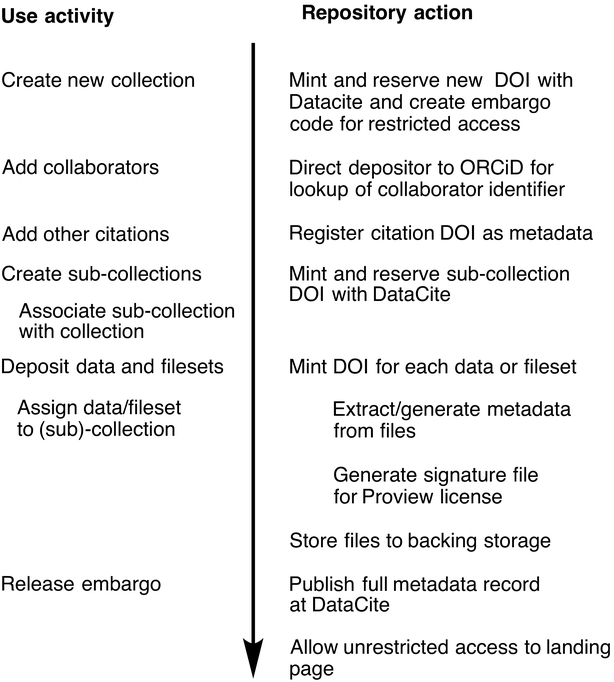
Researchers are increasingly required to make research data publicly available in data repositories. Although several organizations propose criteria to recommend and evaluate the quality of data repositories, there is no consensus of what constitutes a good data repository. In this paper, we investigate, first, which data repositories are recommended by various stakeholders (publishers, funders, and community organizations) and second, which repositories are certified by a number of organizations. We then compare these two lists of repositories, and the criteria for recommendation and certification. We find that criteria used by organizations recommending and certifying repositories are similar, although the certification criteria are generally more detailed. We distill the lists of criteria into seven main categories: “Mission,” “Community/Recognition,” “Legal and Contractual Compliance,” “Access/Accessibility,” “Technical Structure/Interface,” “Retrievability,” and “Preservation.” Although the criteria are similar, the lists of repositories that are recommended by the various agencies are very different. Out of all of the recommended repositories, less than six percent obtained certification. As certification is becoming more important, steps should be taken to decrease this gap between recommended and certified repositories, and ensure that certification standards become applicable, and applied, to the repositories which researchers are currently using. ('''[[Journal:Recommended versus certified repositories: Mind the gap|Full article...]]''')<br /> | |||
|- | |||
|<br /><h2 style="font-size:105%; font-weight:bold; text-align:left; color:#000; padding:0.2em 0.4em; width:50%;">Featured article of the week: December 4–10:</h2> | |||
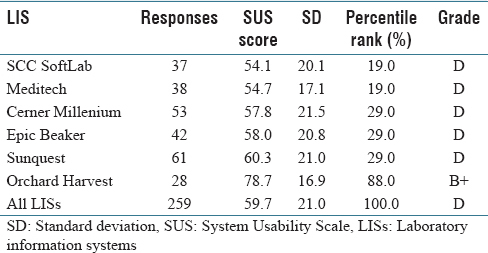
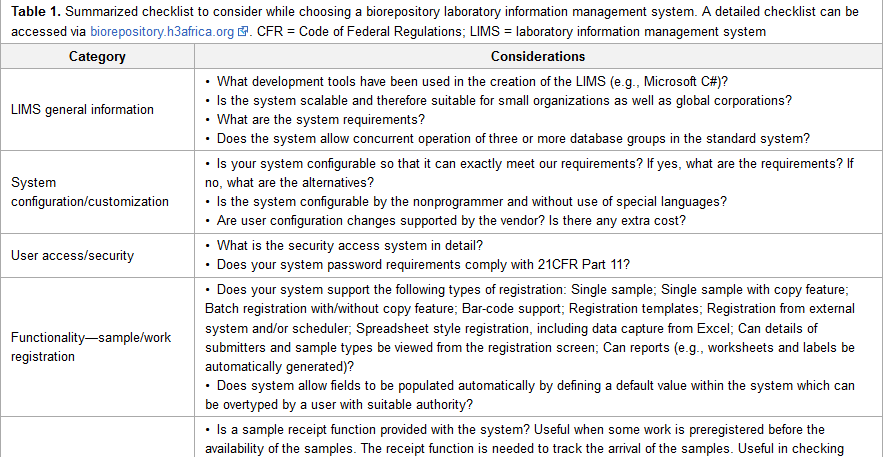
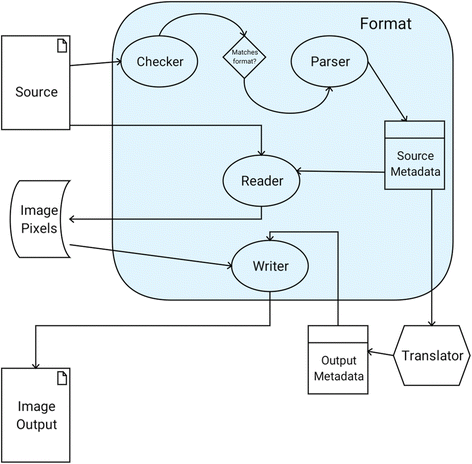
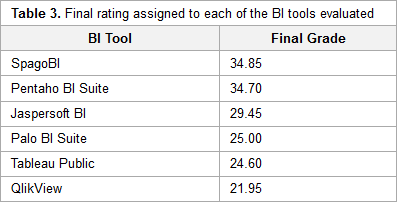
<div style="float: left; margin: 0.5em 0.9em 0.4em 0em;">[[File:Tab2 Matthews JPathInfo2017 8.jpg|240px]]</div> | |||
'''"[[Journal:Usability evaluation of laboratory information systems|Usability evaluation of laboratory information systems]]"''' | |||
Numerous studies have revealed widespread clinician frustration with the usability of [[electronic health record]]s (EHRs) that is counterproductive to adoption of EHR systems to meet the aims of healthcare reform. With poor system usability comes increased risk of negative unintended consequences. Usability issues could lead to user error and workarounds that have the potential to compromise patient safety and negatively impact the quality of care. While there is ample research on EHR usability, there is little [[information]] on the usability of [[laboratory information system]]s (LIS). Yet, an LIS facilitates the timely provision of a great deal of the information needed by physicians to make patient care decisions. Medical and technical advances in genomics that require processing of an increased volume of complex [[laboratory]] data further underscore the importance of developing a user-friendly LIS. This study aims to add to the body of knowledge on LIS usability. ('''[[Journal:Usability evaluation of laboratory information systems|Full article...]]''')<br /> | |||
|- | |||
|<br /><h2 style="font-size:105%; font-weight:bold; text-align:left; color:#000; padding:0.2em 0.4em; width:50%;">Featured article of the week: November 27–December 3:</h2> | |||
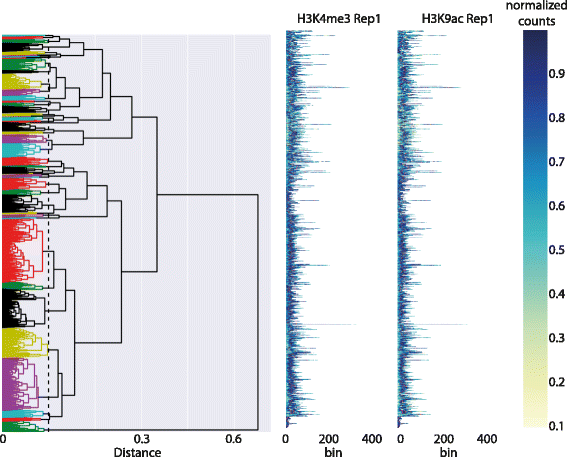
<div style="float: left; margin: 0.5em 0.9em 0.4em 0em;">[[File:Fig3 Martin LIBER2017 27-1.jpg|240px]]</div> | |||
'''"[[Journal:Data management: New tools, new organization, and new skills in a French research institute|Data management: New tools, new organization, and new skills in a French research institute]]"''' | |||
In the context of e-science and open access, visibility and impact of scientific results and data have become important aspects for spreading [[information]] to users and to the society in general. The objective of this general trend of the economy is to feed the innovation process and create economic value. In our institute, the French National Research Institute of Science and Technology for Environment and Agriculture, Irstea, the department in charge of scientific and technical information, with the help of other professionals (scientists, IT professionals, ethics advisors, etc.), has recently developed suitable services for researchers and their data management needs in order to answer European recommendations for open data. This situation has demanded a review of the different workflows between databases, questioning the organizational aspects among skills, occupations, and departments in the institute. In fact, data management involves all professionals and researchers assessing their workflows together. ('''[[Journal:Data management: New tools, new organization, and new skills in a French research institute|Full article...]]''')<br /> | |||
|- | |||
|<br /><h2 style="font-size:105%; font-weight:bold; text-align:left; color:#000; padding:0.2em 0.4em; width:50%;">Featured article of the week: November 20–26:</h2> | |||
<div style="float: left; margin: 0.5em 0.9em 0.4em 0em;">[[File:Fig1 Bellgard FrontPubHealth2017 5.jpg|240px]]</div> | |||
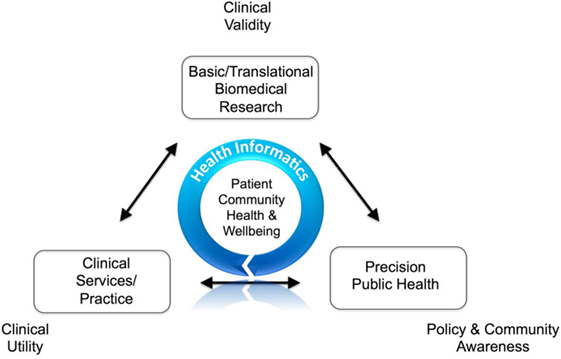
'''"[[Journal:Comprehending the health informatics spectrum: Grappling with system entropy and advancing quality clinical research|Comprehending the health informatics spectrum: Grappling with system entropy and advancing quality clinical research]]"''' | |||
Clinical research is complex. The knowledge base is [[information]]- and data-rich, where value and success depend upon focused, well-designed connectivity of systems achieved through stakeholder collaboration. Quality data, information, and knowledge must be utilized in an effective, efficient, and timely manner to affect important clinical decisions and communicate health prevention strategies. In recent decades, it has become apparent that information communication technology (ICT) solutions potentially offer multidimensional opportunities for transforming health care and clinical research. However, it is also recognized that successful utilization of ICT in improving patient care and health outcomes depends on a number of factors such as the effective integration of diverse sources of health data; how and by whom quality data are captured; reproducible methods on how data are interrogated and reanalyzed; robust policies and procedures for data privacy, security and access; usable consumer and clinical user interfaces; effective diverse stakeholder engagement; and navigating the numerous eclectic and non-interoperable legacy proprietary health ICT solutions in [[hospital]] and clinic environments. This is broadly termed [[health informatics]] (HI). ('''[[Journal:Comprehending the health informatics spectrum: Grappling with system entropy and advancing quality clinical research|Full article...]]''')<br /> | |||
|- | |||
|<br /><h2 style="font-size:105%; font-weight:bold; text-align:left; color:#000; padding:0.2em 0.4em; width:50%;">Featured article of the week: November 13–19:</h2> | |||
<div style="float: left; margin: 0.5em 0.9em 0.4em 0em;">[[File:Fig1 Huang ICTExpress2017 3-2.jpg|240px]]</div> | |||
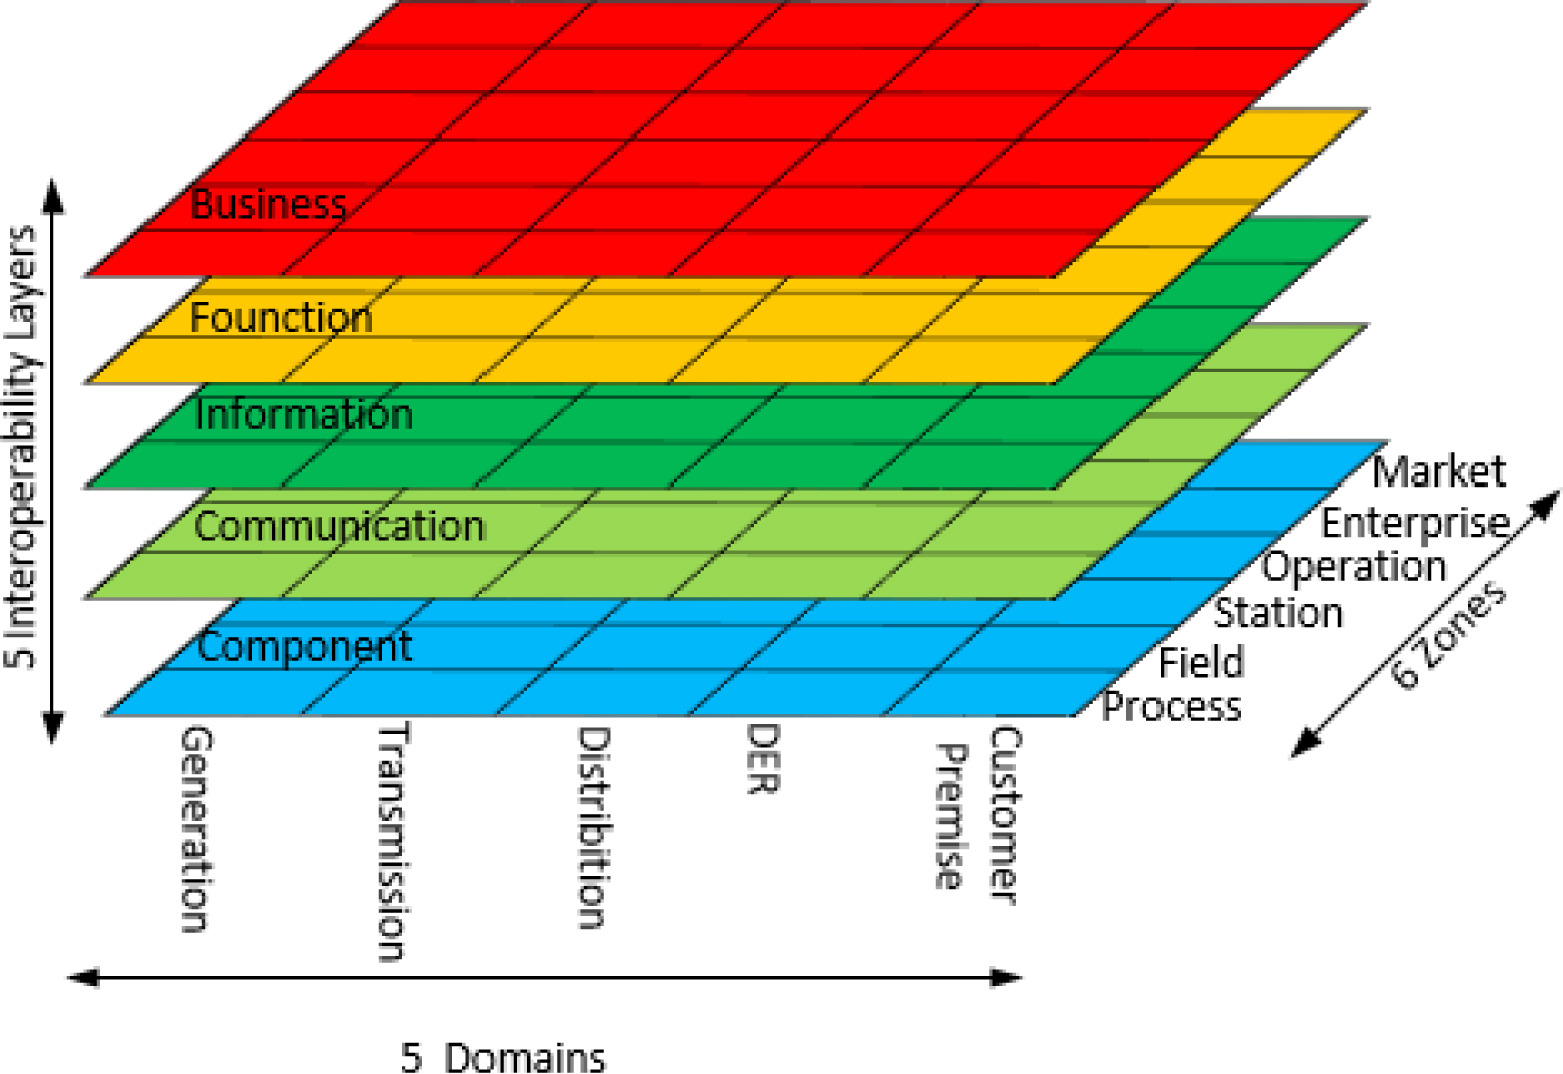
'''"[[Journal:Energy informatics: Fundamentals and standardization|Energy informatics: Fundamentals and standardization]]"''' | |||
Based on international standardization and power utility practices, this paper presents a preliminary and systematic study on the field of energy [[informatics]] and analyzes boundary expansion of information and energy systems, and the convergence of energy systems and ICT. A comprehensive introduction of the fundamentals and standardization of energy informatics is provided, and several key open issues are identified. | |||
With the changing of global climate and a world energy shortage, a smooth transition from conventional fossil fuel-based energy supplies to renewable energy sources is critical for the sustainable development of human society. Meanwhile, the energy domain is experiencing a paradigmatic change by integrating conventional energy systems with advanced [[information]] and communication technologies (ICT), which poses new challenges to the efficient operation and design of energy systems. ('''[[Journal:Energy informatics: Fundamentals and standardization|Full article...]]''')<br /> | |||
|- | |||
|<br /><h2 style="font-size:105%; font-weight:bold; text-align:left; color:#000; padding:0.2em 0.4em; width:50%;">Featured article of the week: November 6–12:</h2> | |||
<div style="float: left; margin: 0.5em 0.9em 0.4em 0em;">[[File:Fig3 Vaas PeerJCompSci2016 2.jpg|240px]]</div> | |||
'''"[[Journal:Electronic laboratory notebooks in a public–private partnership|Electronic laboratory notebooks in a public–private partnership]]"''' | |||
This report shares the experience during selection, implementation and maintenance phases of an [[electronic laboratory notebook]] (ELN) in a public–private partnership project and comments on users' feedback. In particular, we address which time constraints for roll-out of an ELN exist in granted projects and which benefits and/or restrictions come with out-of-the-box solutions. We discuss several options for the implementation of support functions and potential advantages of open-access solutions. Connected to that, we identified willingness and a vivid culture of data sharing as the major item leading to success or failure of collaborative research activities. The feedback from users turned out to be the only angle for driving technical improvements, but also exhibited high efficiency. Based on these experiences, we describe best practices for future projects on implementation and support of an ELN supporting a diverse, multidisciplinary user group based in academia, NGOs, and/or for-profit corporations located in multiple time zones. ('''[[Journal:Electronic laboratory notebooks in a public–private partnership|Full article...]]''')<br /> | |||
|- | |||
|<br /><h2 style="font-size:105%; font-weight:bold; text-align:left; color:#000; padding:0.2em 0.4em; width:50%;">Featured article of the week: October 30–November 5:</h2> | |||
'''"[[Journal:Laboratory information system – Where are we today?|Laboratory information system – Where are we today?]]"''' | |||
Wider implementation of [[laboratory information system]]s (LIS) in [[Clinical laboratory|clinical laboratories]] in Serbia was initiated 10 years ago. The first LIS in the Railway Health Care Institute was implemented nine years ago. Before the LIS was initiated, manual admission procedures limited daily output of patients. Moreover, manual entering of patient data and ordering tests on analyzers was problematic and time-consuming. After completing tests, [[laboratory]] personnel had to write results in a patient register (with potential errors) and provide invoices for health insurance organizations. The first LIS brought forward some advantages with regards to these obstacles, but it also showed various weaknesses. These can be summarized as rigidity of the system and inability to fulfill user expectation. After four years of use, we replaced this system with another LIS. Hence, the main aim of this paper is to evaluate the advantages of using LIS in the Railway Health Care Institute's laboratory and also to discuss further possibilities for its application. ('''[[Journal:Laboratory information system – Where are we today?|Full article...]]''')<br /> | |||
|- | |||
|<br /><h2 style="font-size:105%; font-weight:bold; text-align:left; color:#000; padding:0.2em 0.4em; width:50%;">Featured article of the week: October 23–29:</h2> | |||
<div style="float: left; margin: 0.5em 0.9em 0.4em 0em;">[[File:Fig1 Deliberato JMIRMedInfo2017 5-3.png|240px]]</div> | |||
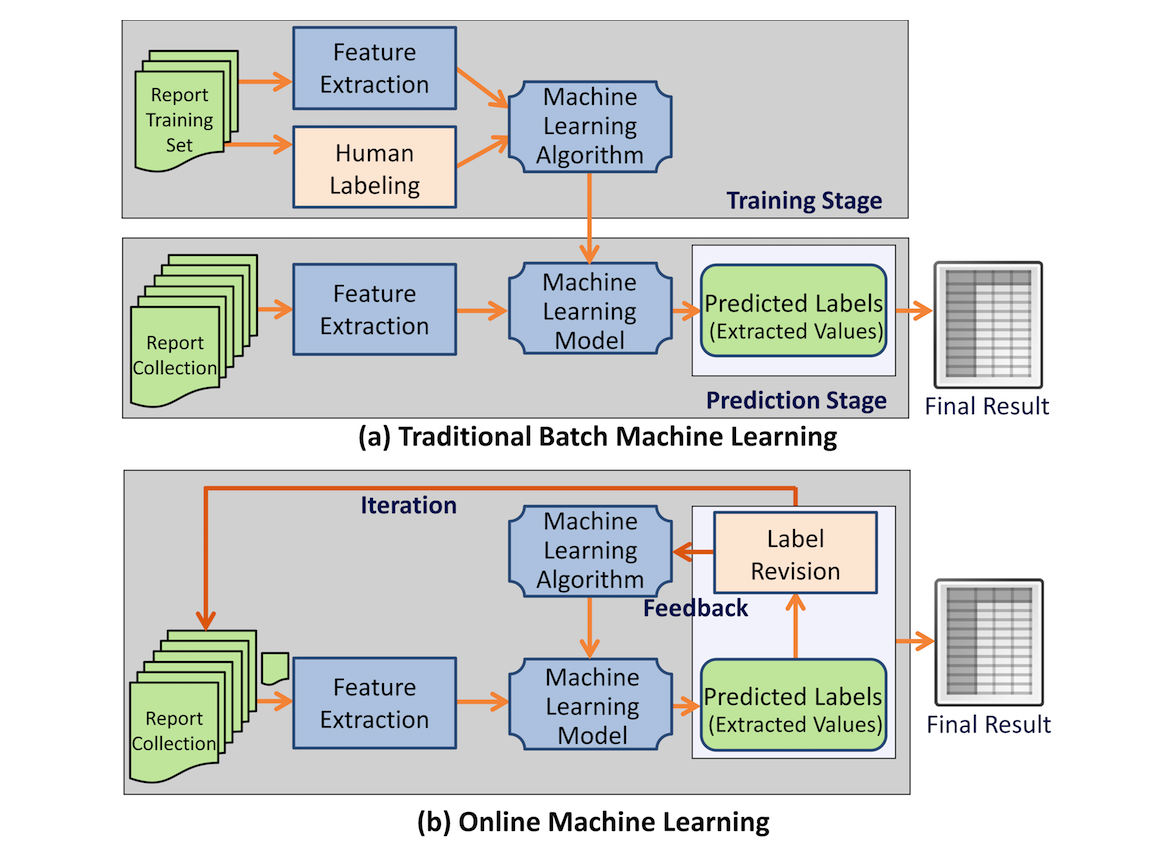
'''"[[Journal:Clinical note creation, binning, and artificial intelligence|Clinical note creation, binning, and artificial intelligence]]"''' | |||
The creation of medical notes in software applications poses an intrinsic problem in workflow as the technology inherently intervenes in the processes of collecting and assembling [[information]], as well as the production of a data-driven note that meets both individual and healthcare system requirements. In addition, the note writing applications in currently available [[electronic health record]]s (EHRs) do not function to support decision making to any substantial degree. We suggest that artificial intelligence (AI) could be utilized to facilitate the workflows of the data collection and assembly processes, as well as to support the development of personalized, yet data-driven assessments and plans. ('''[[Journal:Clinical note creation, binning, and artificial intelligence|Full article...]]''')<br /> | |||
|- | |||
|<br /><h2 style="font-size:105%; font-weight:bold; text-align:left; color:#000; padding:0.2em 0.4em; width:50%;">Featured article of the week: October 16–22:</h2> | |||
<div style="float: left; margin: 0.5em 0.9em 0.4em 0em;">[[File:Fig3 Panahiazar JofBiomedInformatics2017 72-8.jpg|240px]]</div> | |||
'''"[[Journal:Predicting biomedical metadata in CEDAR: A study of Gene Expression Omnibus (GEO)|Predicting biomedical metadata in CEDAR: A study of Gene Expression Omnibus (GEO)]]"''' | |||
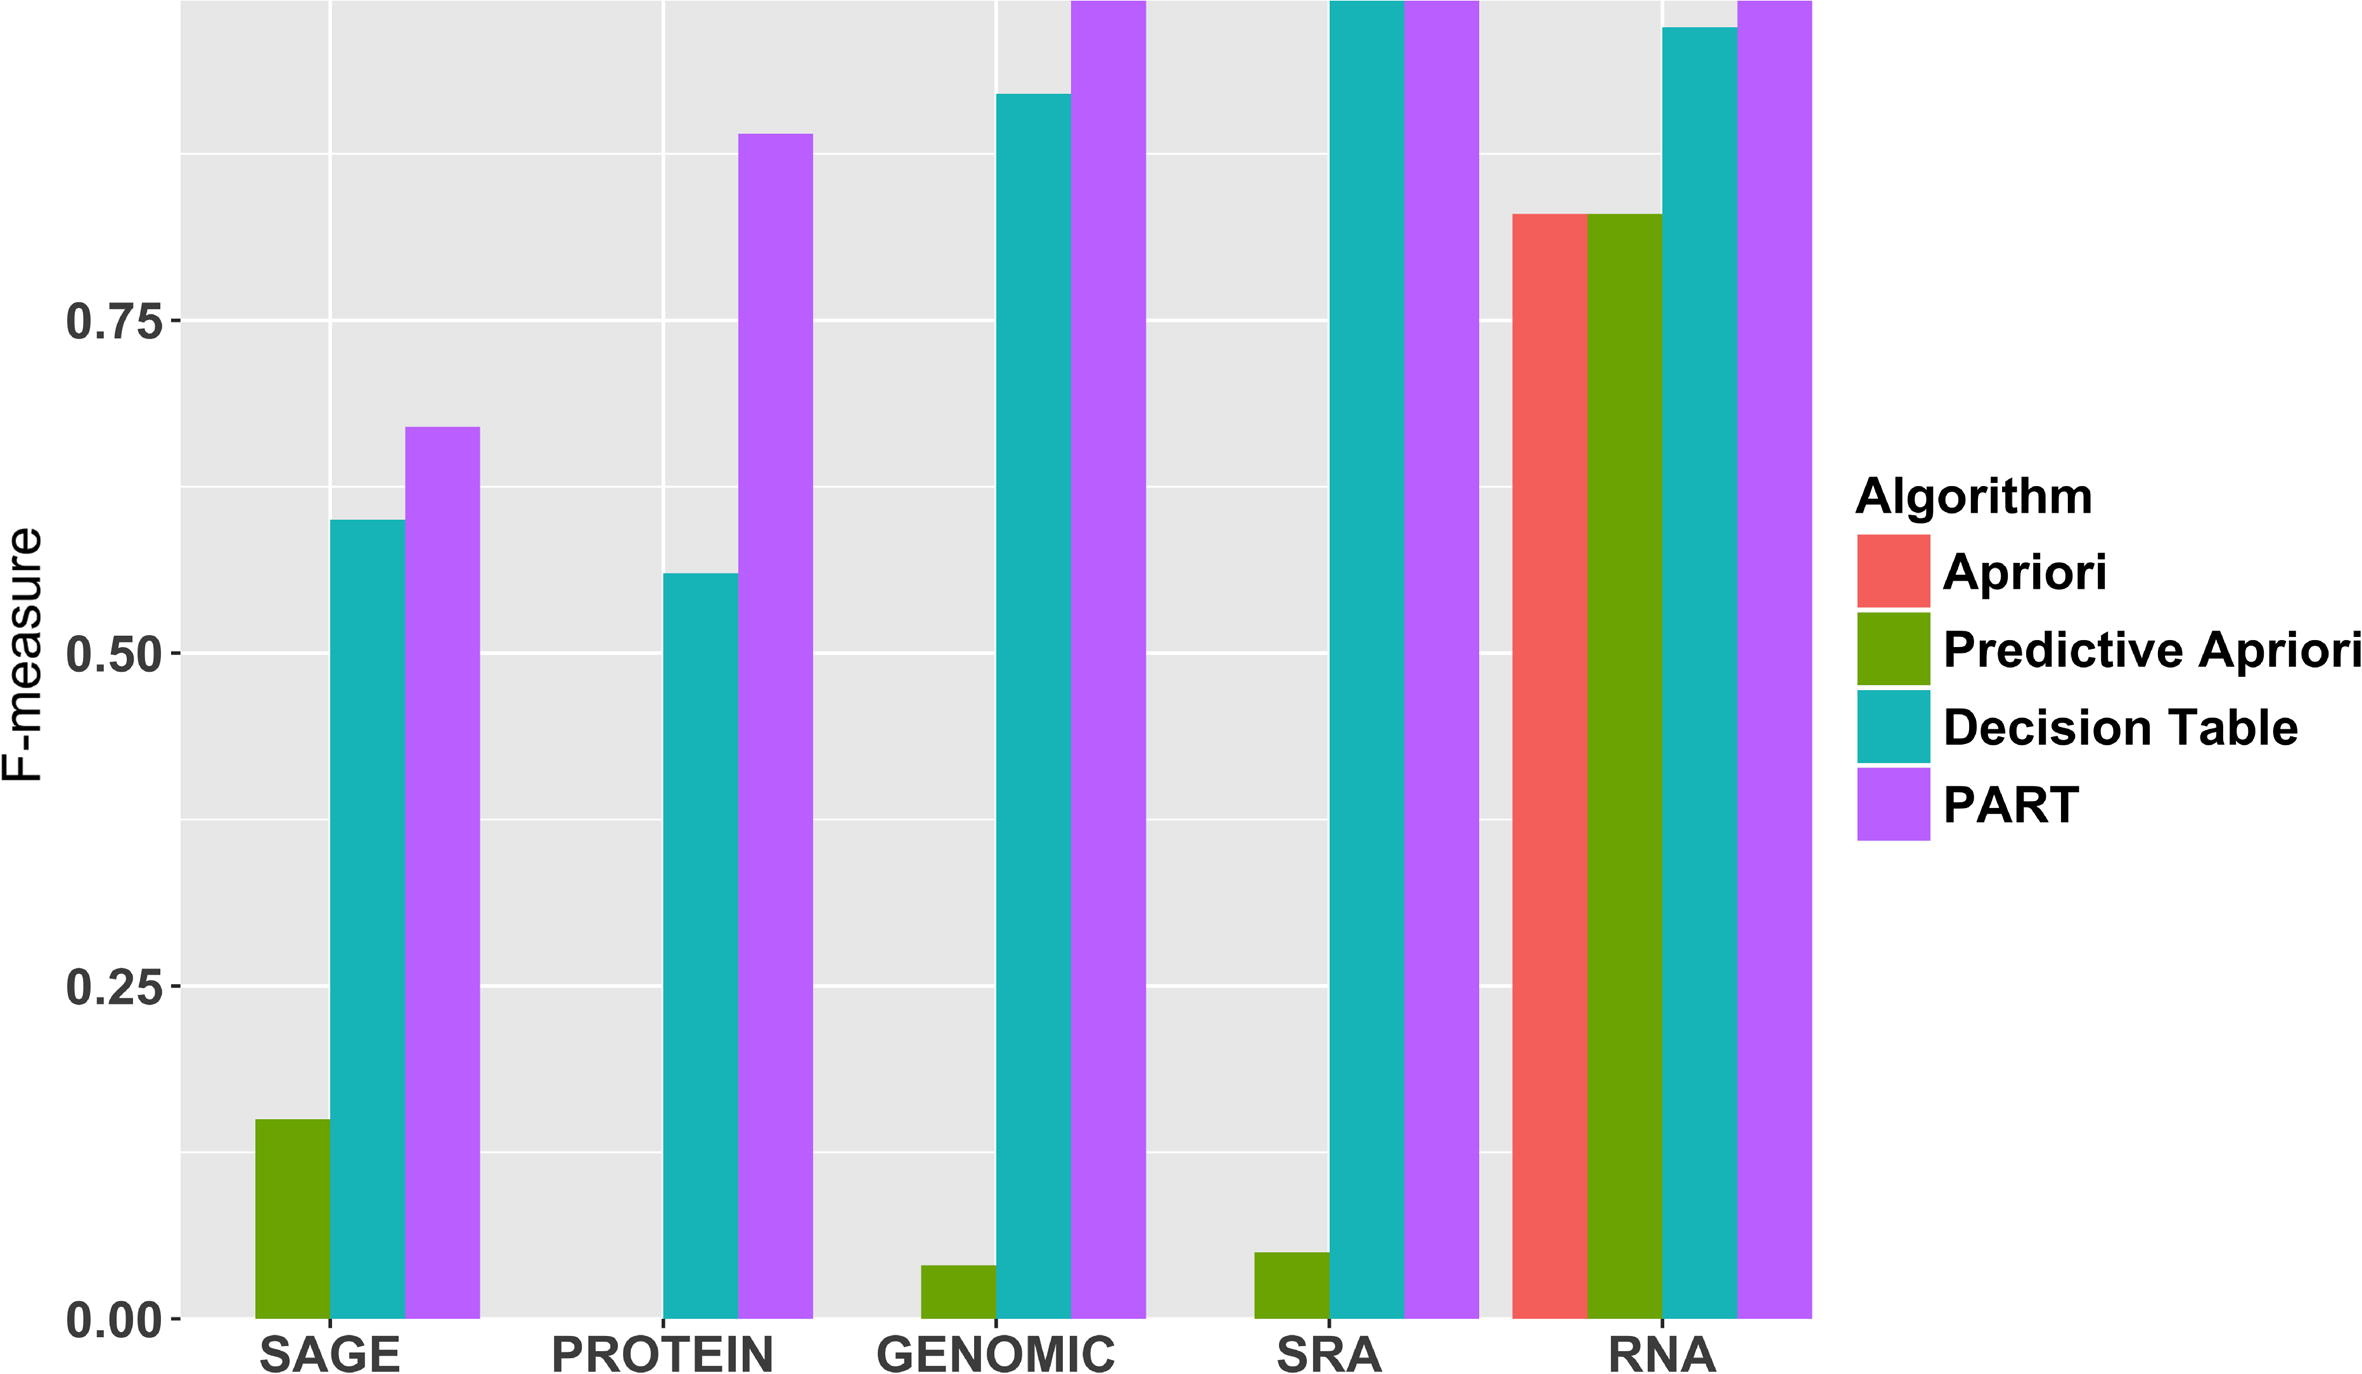
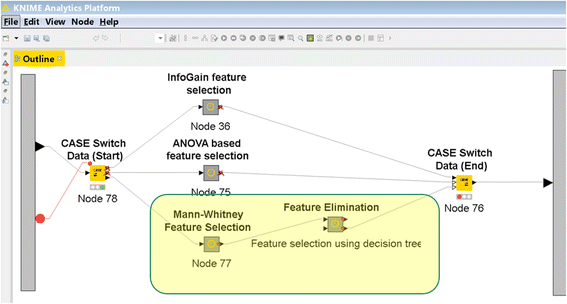
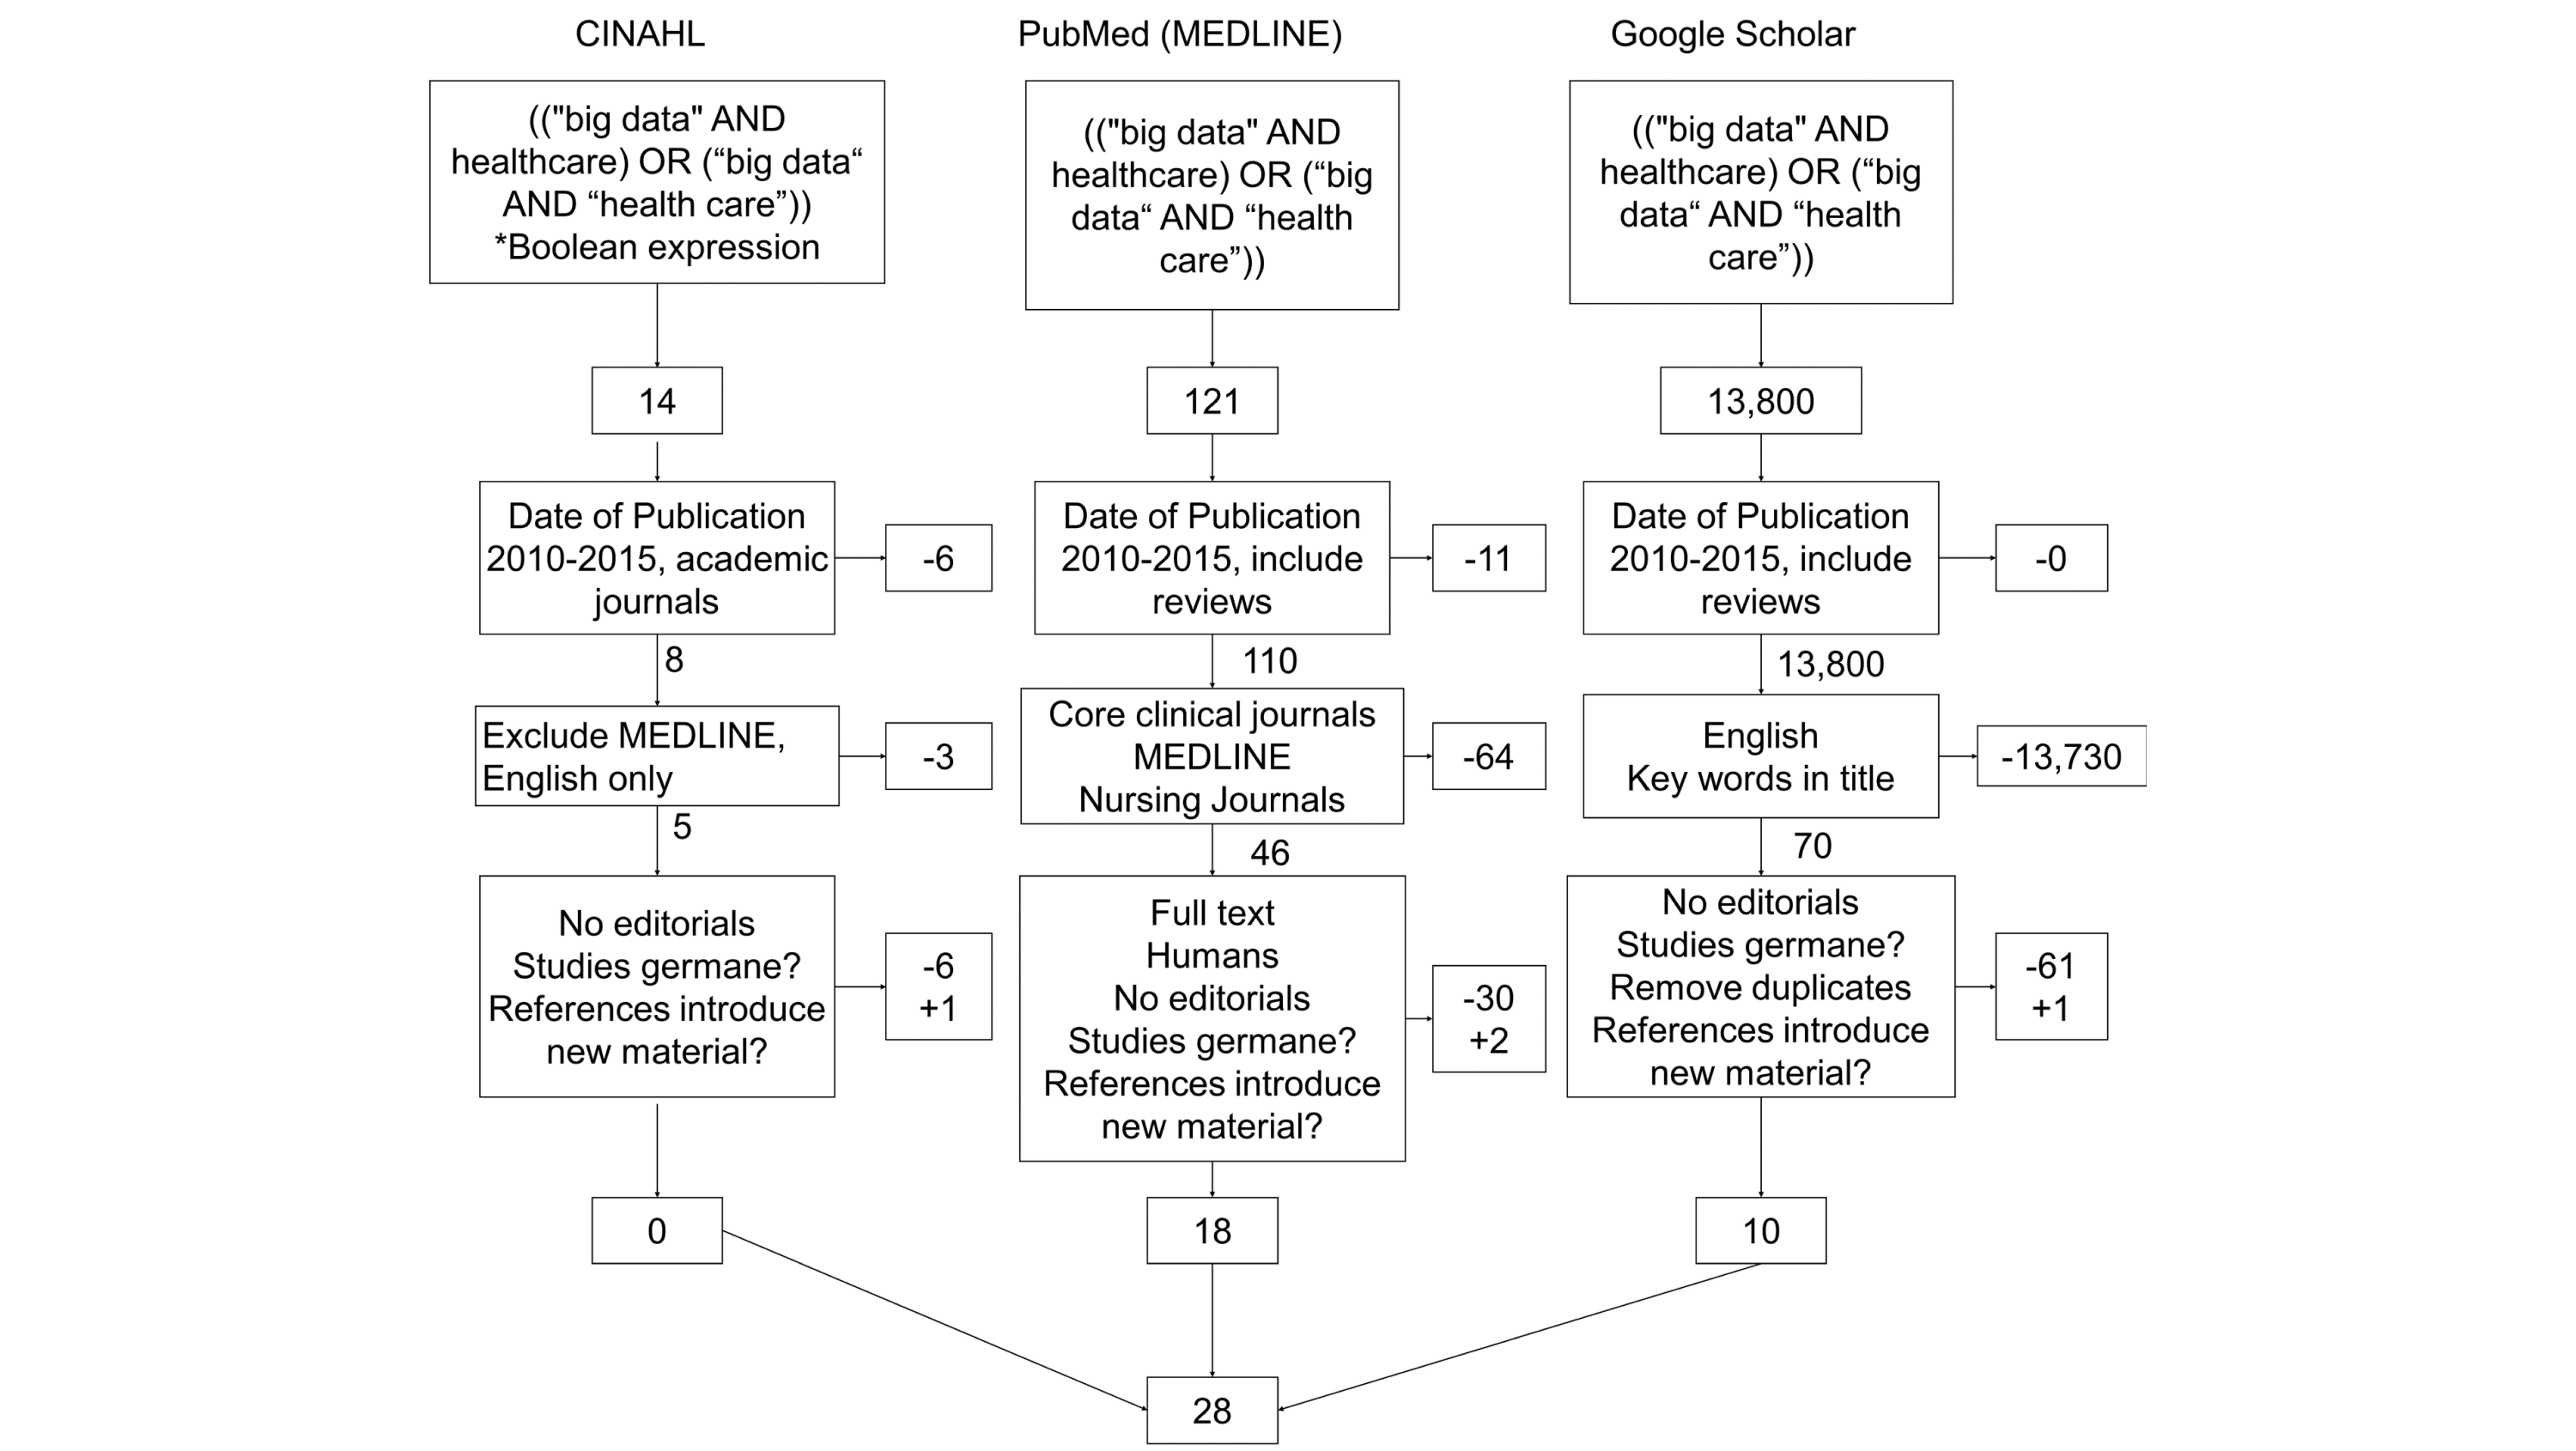
A crucial and limiting factor in data reuse is the lack of accurate, structured, and complete descriptions of data, known as metadata. Towards improving the quantity and quality of metadata, we propose a novel metadata prediction framework to learn associations from existing metadata that can be used to predict metadata values. We evaluate our framework in the context of experimental metadata from the Gene Expression Omnibus (GEO). We applied four rule mining algorithms to the most common structured metadata elements (sample type, molecular type, platform, label type and organism) from over 1.3 million GEO records. We examined the quality of well supported rules from each algorithm and visualized the dependencies among metadata elements. Finally, we evaluated the performance of the algorithms in terms of accuracy, precision, recall, and F-measure. We found that PART is the best algorithm outperforming Apriori, Predictive Apriori, and Decision Table. | |||
All algorithms perform significantly better in predicting class values than the majority vote classifier. We found that the performance of the algorithms is related to the dimensionality of the GEO elements. ('''[[Journal:Predicting biomedical metadata in CEDAR: A study of Gene Expression Omnibus (GEO)|Full article...]]''')<br /> | |||
|- | |||
|<br /><h2 style="font-size:105%; font-weight:bold; text-align:left; color:#000; padding:0.2em 0.4em; width:50%;">Featured article of the week: October 9–15:</h2> | |||
<div style="float: left; margin: 0.5em 0.9em 0.4em 0em;">[[File:Fig1 Tsur BioDataMining2017 10.gif|240px]]</div> | |||
'''"[[Journal:Rapid development of entity-based data models for bioinformatics with persistence object-oriented design and structured interfaces|Rapid development of entity-based data models for bioinformatics with persistence object-oriented design and structured interfaces]]"''' | |||
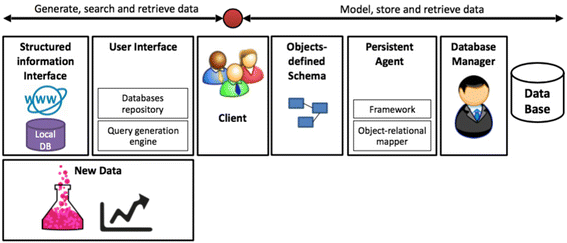
Databases are imperative for research in [[bioinformatics]] and computational biology. Current challenges in database design include data heterogeneity and context-dependent interconnections between data entities. These challenges drove the development of unified data interfaces and specialized databases. The curation of specialized databases is an ever-growing challenge due to the introduction of new data sources and the emergence of new relational connections between established datasets. Here, an open-source framework for the curation of specialized databases is proposed. The framework supports user-designed models of data encapsulation, object persistence and structured interfaces to local and external data sources such as MalaCards, Biomodels and the National Center for Biotechnology Information (NCBI) databases. The proposed framework was implemented using Java as the development environment, EclipseLink as the data persistence agent and Apache Derby as the database manager. Syntactic analysis was based on J3D, jsoup, Apache Commons and w3c.dom open libraries. Finally, a construction of a specialized database for aneurysm-associated vascular diseases is demonstrated. This database contains three-dimensional geometries of aneurysms, patients' clinical information, articles, biological models, related diseases and our recently published model of aneurysms’ risk of rapture. The framework is available at: http://nbel-lab.com. ('''[[Journal:Rapid development of entity-based data models for bioinformatics with persistence object-oriented design and structured interfaces|Full article...]]''')<br /> | |||
|- | |||
|<br /><h2 style="font-size:105%; font-weight:bold; text-align:left; color:#000; padding:0.2em 0.4em; width:50%;">Featured article of the week: October 2–8:</h2> | |||
<div style="float: left; margin: 0.5em 0.9em 0.4em 0em;">[[File:Fig1 Clay CancerInformatics2017 16.png|240px]]</div> | |||
'''"[[Journal:Bioinformatics education in pathology training: Current scope and future direction|Bioinformatics education in pathology training: Current scope and future direction]]"''' | |||
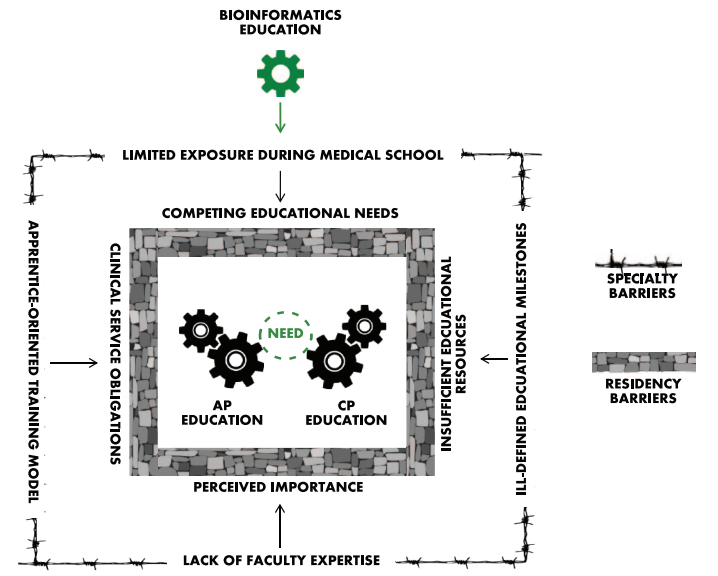
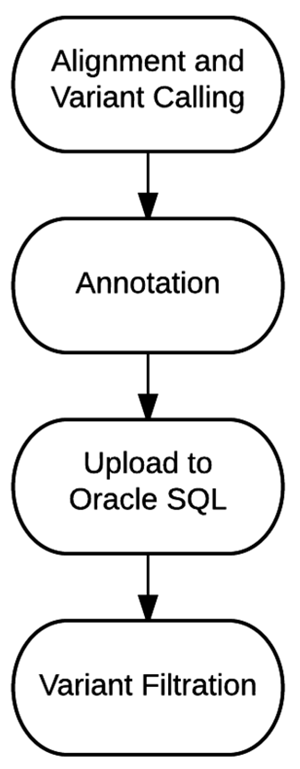
Training [[Anatomical pathology|anatomic]] and [[clinical pathology]] residents in the principles of [[bioinformatics]] is a challenging endeavor. Most residents receive little to no formal exposure to bioinformatics during medical education, and most of the pathology training is spent interpreting [[histopathology]] slides using light microscopy or focused on laboratory regulation, management, and interpretation of discrete [[laboratory]] data. At a minimum, residents should be familiar with data structure, data pipelines, data manipulation, and data regulations within [[Clinical laboratory|clinical laboratories]]. Fellowship-level training should incorporate advanced principles unique to each subspecialty. Barriers to bioinformatics education include the clinical apprenticeship training model, ill-defined educational milestones, inadequate faculty expertise, and limited exposure during medical training. Online educational resources, case-based learning, and incorporation into molecular genomics education could serve as effective educational strategies. Overall, pathology bioinformatics training can be incorporated into pathology resident curricula, provided there is motivation to incorporate institutional support, educational resources, and adequate faculty expertise. ('''[[Journal:Bioinformatics education in pathology training: Current scope and future direction|Full article...]]''')<br /> | |||
|- | |||
|<br /><h2 style="font-size:105%; font-weight:bold; text-align:left; color:#000; padding:0.2em 0.4em; width:50%;">Featured article of the week: September 25–October 1:</h2> | |||
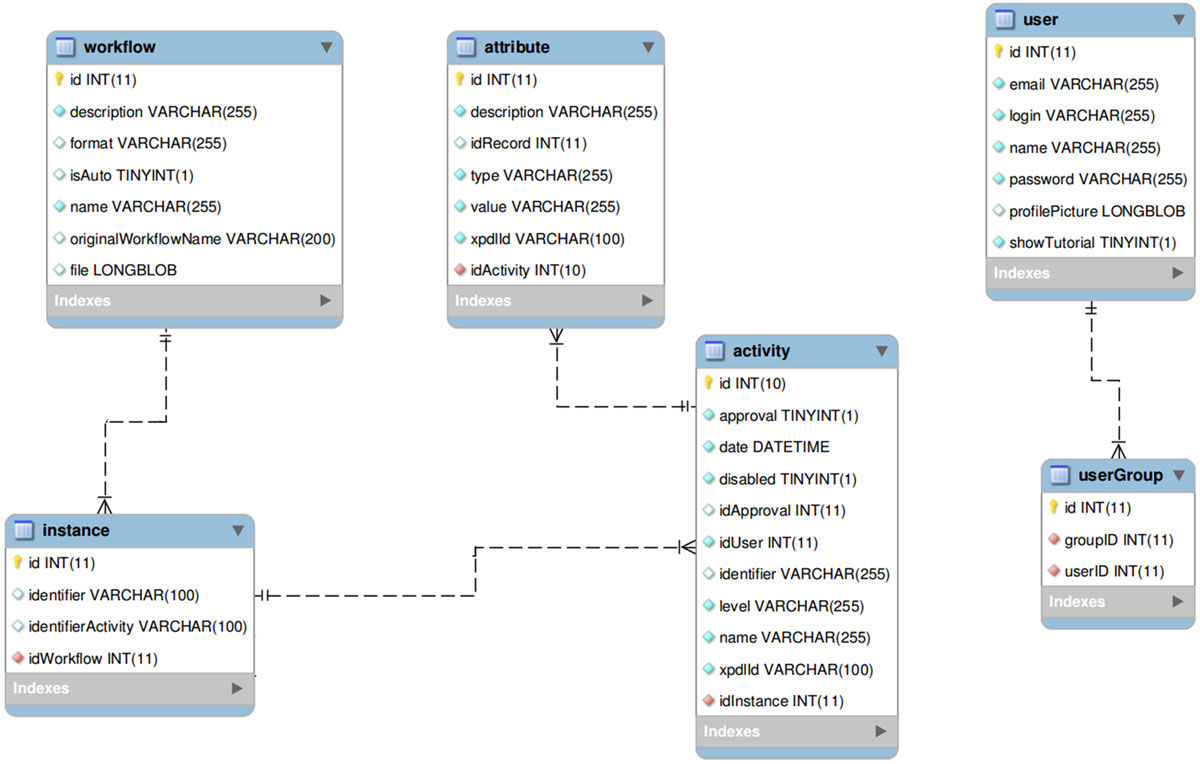
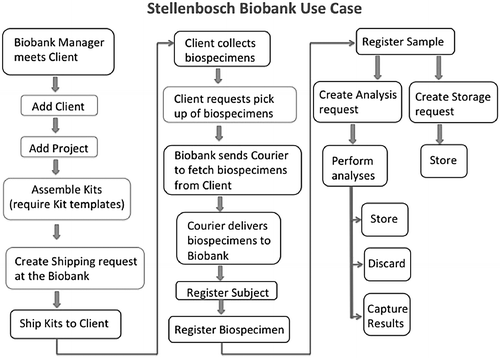
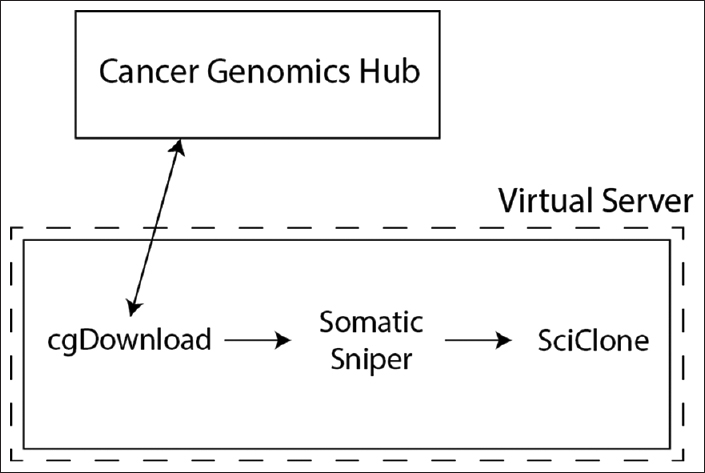
<div style="float: left; margin: 0.5em 0.9em 0.4em 0em;">[[File:Fig1 Faria-Campos BMCBioinformatics2015 16-S19.jpg|240px]]</div> | |||
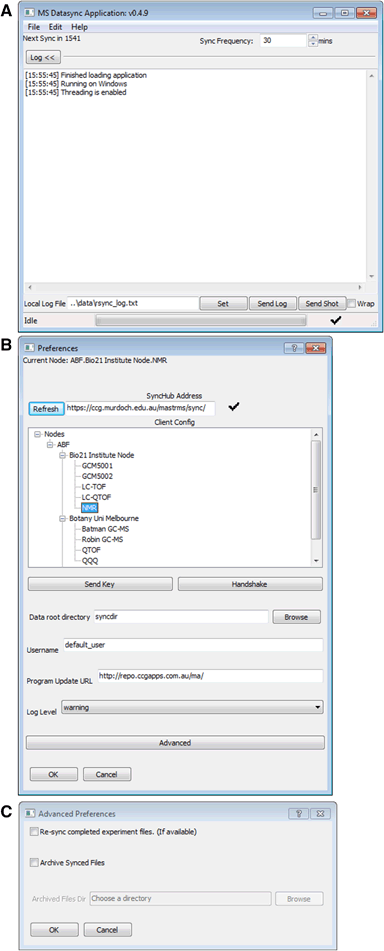
'''"[[Journal:FluxCTTX: A LIMS-based tool for management and analysis of cytotoxicity assays data|FluxCTTX: A LIMS-based tool for management and analysis of cytotoxicity assays data]]"''' | |||
Cytotoxicity assays have been used by researchers to screen for cytotoxicity in compound libraries. Researchers can either look for cytotoxic compounds or screen "hits" from initial high-throughput drug screens for unwanted cytotoxic effects before investing in their development as a pharmaceutical. These assays may be used as an alternative to animal experimentation and are becoming increasingly important in modern laboratories. However, the execution of these assays in large-scale and different laboratories requires, among other things, the management of protocols, reagents, and cell lines used, as well as the data produced, which can be a challenge. The management of all this information is greatly improved by the utilization of computational tools to save time and guarantee quality. However, a tool that performs this task designed specifically for cytotoxicity assays is not yet available. | |||
In this work, we have used a workflow based LIMS — [[Vendor:Satya Sistemas Ltda.#Flux2|the Flux system]] — and the Together Workflow Editor as a framework to develop FluxCTTX, a tool for management of data from cytotoxicity assays performed at different laboratories. ('''[[Journal:FluxCTTX: A LIMS-based tool for management and analysis of cytotoxicity assays data|Full article...]]''')<br /> | |||
|- | |||
|<br /><h2 style="font-size:105%; font-weight:bold; text-align:left; color:#000; padding:0.2em 0.4em; width:50%;">Featured article of the week: September 18–24:</h2> | |||
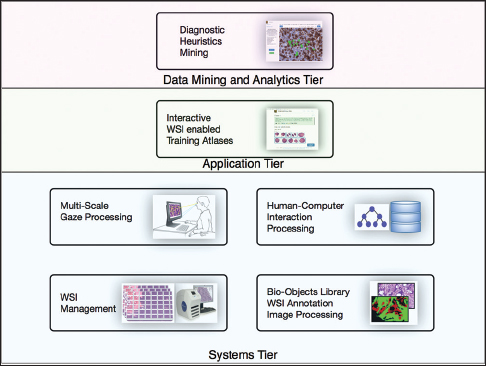
<div style="float: left; margin: 0.5em 0.9em 0.4em 0em;">[[File:Fig1 Shin JofPathInformatics2017 8.jpg|240px]]</div> | |||
'''"[[Journal:PathEdEx – Uncovering high-explanatory visual diagnostics heuristics using digital pathology and multiscale gaze data|PathEdEx – Uncovering high-explanatory visual diagnostics heuristics using digital pathology and multiscale gaze data]]"''' | |||
Visual heuristics of pathology diagnosis is a largely unexplored area where reported studies only provided a qualitative insight into the subject. Uncovering and quantifying pathology visual and non-visual diagnostic patterns have great potential to improve clinical outcomes and avoid diagnostic pitfalls. | |||
Here, we present PathEdEx, an [[informatics]] computational framework that incorporates whole-slide digital pathology imaging with multiscale gaze-tracking technology to create web-based interactive pathology educational atlases and to datamine visual and non-visual diagnostic heuristics. | |||
We demonstrate the capabilities of PathEdEx for mining visual and non-visual diagnostic heuristics using the first PathEdEx volume of a [[Clinical pathology#Sub-specialties|hematopathology]] atlas. We conducted a quantitative study on the time dynamics of zooming and panning operations utilized by experts and novices to come to the correct diagnosis. ('''[[Journal:PathEdEx – Uncovering high-explanatory visual diagnostics heuristics using digital pathology and multiscale gaze data|Full article...]]''')<br /> | |||
|- | |||
|<br /><h2 style="font-size:105%; font-weight:bold; text-align:left; color:#000; padding:0.2em 0.4em; width:50%;">Featured article of the week: September 11–17:</h2> | |||
<div style="float: left; margin: 0.5em 0.9em 0.4em 0em;">[[File:Fig1 Kanza JofCheminformatics2017 9.gif|240px]]</div> | |||
'''"[[Journal:Electronic lab notebooks: Can they replace paper|Electronic lab notebooks: Can they replace paper?]]"''' | |||
Despite the increasingly digital nature of society, there are some areas of research that remain firmly rooted in the past; in this case the [[laboratory notebook]], the last remaining paper component of an experiment. Countless [[electronic laboratory notebook]]s (ELNs) have been created in an attempt to digitize record keeping processes in the lab, but none of them have become a "key player" in the ELN market, due to the many adoption barriers that have been identified in previous research and further explored in the user studies presented here. The main issues identified are the cost of the current available ELNs, their ease of use (or lack of it), and their accessibility issues across different devices and operating systems. Evidence suggests that whilst scientists willingly make use of generic notebooking software, spreadsheets, and other general office and scientific tools to aid their work, current ELNs are lacking in the required functionality to meet the needs of researchers. In this paper we present our extensive research and user study results, proposing an ELN built upon a pre-existing cloud notebook platform that makes use of accessible popular scientific software and semantic web technologies to help overcome the identified barriers to adoption. ('''[[Journal:Electronic lab notebooks: Can they replace paper|Full article...]]''')<br /> | |||
|- | |||
|<br /><h2 style="font-size:105%; font-weight:bold; text-align:left; color:#000; padding:0.2em 0.4em; width:50%;">Featured article of the week: September 4–10:</h2> | |||
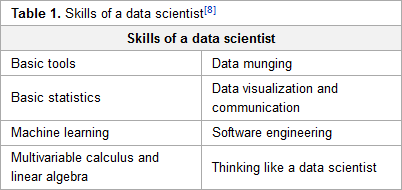
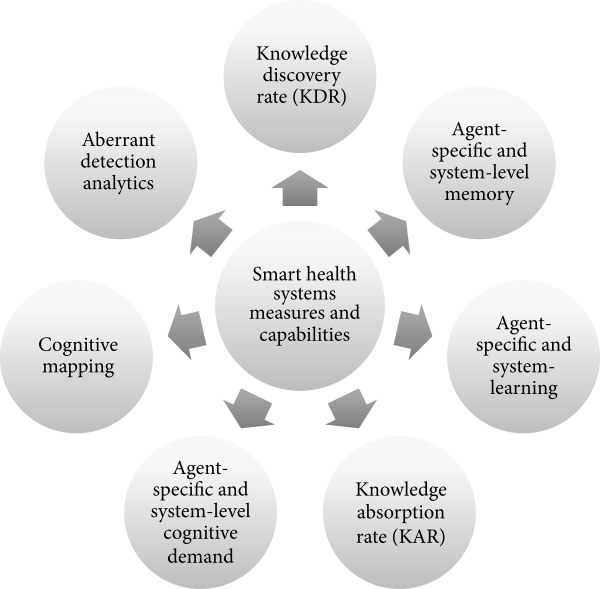
<div style="float: left; margin: 0.5em 0.9em 0.4em 0em;">[[File:Tab1 Kempler DataScienceJournal2017 16.png|240px]]</div> | |||
'''"[[Journal:Earth science data analytics: Definitions, techniques and skills|Earth science data analytics: Definitions, techniques and skills]]"''' | |||
The continuous evolution of data management systems affords great opportunities for the enhancement of knowledge and advancement of science research. To capitalize on these opportunities, it is essential to understand and develop methods that enable data relationships to be examined and [[information]] to be manipulated. Earth science data analytics (ESDA) comprises the techniques and skills needed to holistically extract information and knowledge from all sources of available, often heterogeneous, data sets. This paper reports on the ground-breaking efforts of the Earth Science Information Partners' (ESIP) ESDA Cluster in defining ESDA and identifying ESDA methodologies. As a result of the void of earth science data analytics in the literature, the ESIP ESDA definition and goals serve as an initial framework for a common understanding of techniques and skills that are available, as well as those still needed to support ESDA. Through the acquisition of earth science research use cases and categorization of ESDA result oriented research goals, ESDA techniques/skills have been assembled. The resulting ESDA techniques/skills provide the community with a definition for ESDA that is useful in articulating data management and research needs, as well as a working list of techniques and skills relevant to the different types of ESDA. ('''[[Journal:Earth science data analytics: Definitions, techniques and skills|Full article...]]''')<br /> | |||
|- | |||
|<br /><h2 style="font-size:105%; font-weight:bold; text-align:left; color:#000; padding:0.2em 0.4em; width:50%;">Featured article of the week: August 28–September 3:</h2> | |||
<div style="padding:0.4em 1em 0.3em 1em;"> | |||
'''"[[Journal:Bioinformatics: Indispensable, yet hidden in plain sight|Bioinformatics: Indispensable, yet hidden in plain sight]]"''' | |||
[[Bioinformatics]] has multitudinous identities, organizational alignments and disciplinary links. This variety allows bioinformaticians and bioinformatic work to contribute to much (if not most) of life science research in profound ways. The multitude of bioinformatic work also translates into a multitude of credit-distribution arrangements, apparently dismissing that work. | |||
We report on the epistemic and social arrangements that characterize the relationship between bioinformatics and life science. We describe, in sociological terms, the character, power and future of bioinformatic work. The character of bioinformatic work is such that its cultural, institutional and technical structures allow for it to be black-boxed easily. The result is that bioinformatic expertise and contributions travel easily and quickly, yet remain largely uncredited. The power of bioinformatic work is shaped by its dependency on life science work, which combined with the black-boxed character of bioinformatic expertise further contributes to situating bioinformatics on the periphery of the life sciences. Finally, the imagined futures of bioinformatic work suggest that bioinformatics will become ever more indispensable without necessarily becoming more visible, forcing bioinformaticians into difficult professional and career choices. ('''[[Journal:Global data quality assessment and the situated nature of “best” research practices in biology|Full article...]]''')<br /> | |||
</div> | |||
|- | |||
|<br /><h2 style="font-size:105%; font-weight:bold; text-align:left; color:#000; padding:0.2em 0.4em; width:50%;">Featured article of the week: August 21–27:</h2> | |||
<div style="padding:0.4em 1em 0.3em 1em;"> | |||
'''"[[Journal:Global data quality assessment and the situated nature of “best” research practices in biology|Global data quality assessment and the situated nature of “best” research practices in biology]]"''' | |||
This paper reflects on the relation between international debates around data quality assessment and the diversity characterizing research practices, goals and environments within the life sciences. Since the emergence of molecular approaches, many biologists have focused their research, and related methods and instruments for data production, on the study of genes and genomes. While this trend is now shifting, prominent institutions and companies with stakes in molecular biology continue to set standards for what counts as "good science" worldwide, resulting in the use of specific data production technologies as proxy for assessing data quality. This is problematic considering (1) the variability in research cultures, goals and the very characteristics of biological systems, which can give rise to countless different approaches to knowledge production; and (2) the existence of research environments that produce high-quality, significant datasets despite not availing themselves of the latest technologies. Ethnographic research carried out in such environments evidences a widespread fear among researchers that providing extensive information about their experimental set-up will affect the perceived quality of their data, making their findings vulnerable to criticisms by better-resourced peers. These fears can make scientists resistant to sharing data or describing their provenance. ('''[[Journal:Global data quality assessment and the situated nature of “best” research practices in biology|Full article...]]''')<br /> | |||
</div> | |||
|- | |||
|<br /><h2 style="font-size:105%; font-weight:bold; text-align:left; color:#000; padding:0.2em 0.4em; width:50%;">Featured article of the week: August 14–20:</h2> | |||
<div style="padding:0.4em 1em 0.3em 1em;"> | |||
<div style="float: left; margin: 0.5em 0.9em 0.4em 0em;">[[File:Fig1 Grigis FInNeuroinformatics2017 11.jpg|240px]]</div> | |||
'''"[[Journal:Neuroimaging, genetics, and clinical data sharing in Python using the CubicWeb framework|Neuroimaging, genetics, and clinical data sharing in Python using the CubicWeb framework]]"''' | |||
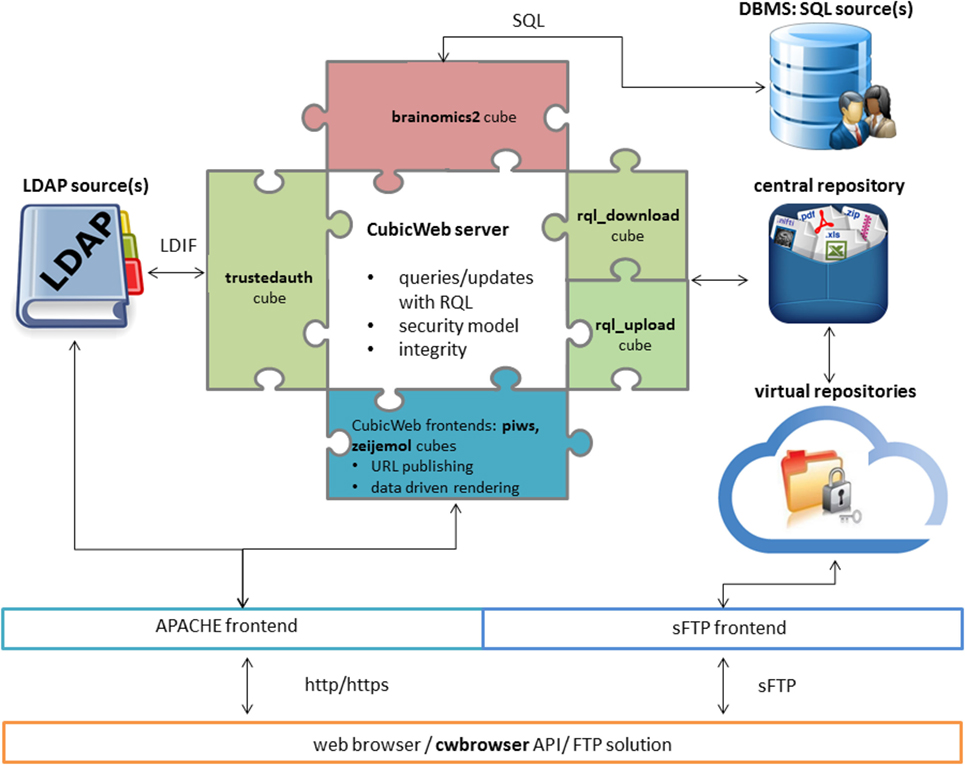
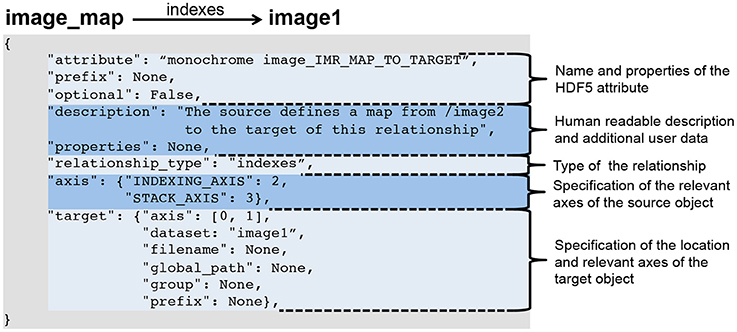
In neurosciences or psychiatry, the emergence of large multi-center population imaging studies raises numerous technological challenges. From distributed data collection, across different institutions and countries, to final data publication service, one must handle the massive, heterogeneous, and complex data from genetics, imaging, demographics, or clinical scores. These data must be both efficiently obtained and downloadable. We present a Python solution, based on the CubicWeb open-source semantic framework, aimed at building population imaging study repositories. In addition, we focus on the tools developed around this framework to overcome the challenges associated with data sharing and collaborative requirements. We describe a set of three highly adaptive web services that transform the CubicWeb framework into a (1) multi-center upload platform, (2) collaborative quality assessment platform, and (3) publication platform endowed with massive-download capabilities. Two major European projects, IMAGEN and EU-AIMS, are currently supported by the described framework. We also present a Python package that enables end users to remotely query neuroimaging, genetics, and clinical data from scripts. ('''[[Journal:Neuroimaging, genetics, and clinical data sharing in Python using the CubicWeb framework|Full article...]]''')<br /> | |||
</div> | |||
|- | |||
|<br /><h2 style="font-size:105%; font-weight:bold; text-align:left; color:#000; padding:0.2em 0.4em; width:50%;">Featured article of the week: August 7–13:</h2> | |||
<div style="padding:0.4em 1em 0.3em 1em;"> | |||
<div style="float: left; margin: 0.5em 0.9em 0.4em 0em;">[[File:Fig2 Heo BMCBioinformatics2017 18.gif|240px]]</div> | |||
'''"[[Journal:Analyzing the field of bioinformatics with the multi-faceted topic modeling technique|Analyzing the field of bioinformatics with the multi-faceted topic modeling technique]]"''' | |||
[[Bioinformatics]] is an interdisciplinary field at the intersection of molecular biology and computing technology. To characterize the field as a convergent domain, researchers have used bibliometrics, augmented with text-mining techniques for content analysis. In previous studies, Latent Dirichlet Allocation (LDA) was the most representative topic modeling technique for identifying topic structure of subject areas. However, as opposed to revealing the topic structure in relation to metadata such as authors, publication date, and journals, LDA only displays the simple topic structure. | |||
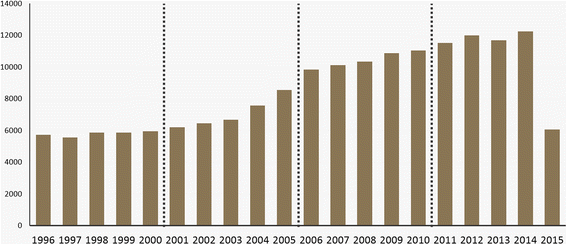
In this paper, we adopt the Author-Conference-Topic (ACT) model of Tang ''et al.'' to study the field of bioinformatics from the perspective of keyphrases, authors, and journals. The ACT model is capable of incorporating the paper, author, and conference into the topic distribution simultaneously. To obtain more meaningful results, we used journals and keyphrases instead of conferences and the bag-of-words. For analysis, we used PubMed to collect forty-six bioinformatics journals from the MEDLINE database. We conducted time series topic analysis over four periods from 1996 to 2015 to further examine the interdisciplinary nature of bioinformatics. ('''[[Journal:Analyzing the field of bioinformatics with the multi-faceted topic modeling technique|Full article...]]''')<br /> | |||
</div> | |||
|- | |||
|<br /><h2 style="font-size:105%; font-weight:bold; text-align:left; color:#000; padding:0.2em 0.4em; width:50%;">Featured article of the week: July 31–August 6:</h2> | |||
<div style="padding:0.4em 1em 0.3em 1em;"> | |||
<div style="float: left; margin: 0.5em 0.9em 0.4em 0em;">[[File:Fig3 Khan BMCBioinformatics2017 18.gif|240px]]</div> | |||
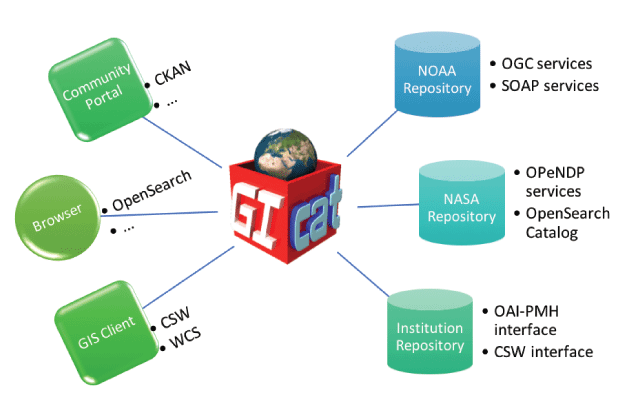
'''"[[Journal:Intervene: A tool for intersection and visualization of multiple gene or genomic region sets|Intervene: A tool for intersection and visualization of multiple gene or genomic region sets]]"''' | |||
A common task for scientists relies on comparing lists of genes or genomic regions derived from high-throughput sequencing experiments. While several tools exist to intersect and visualize sets of genes, similar tools dedicated to the visualization of genomic region sets are currently limited. | |||
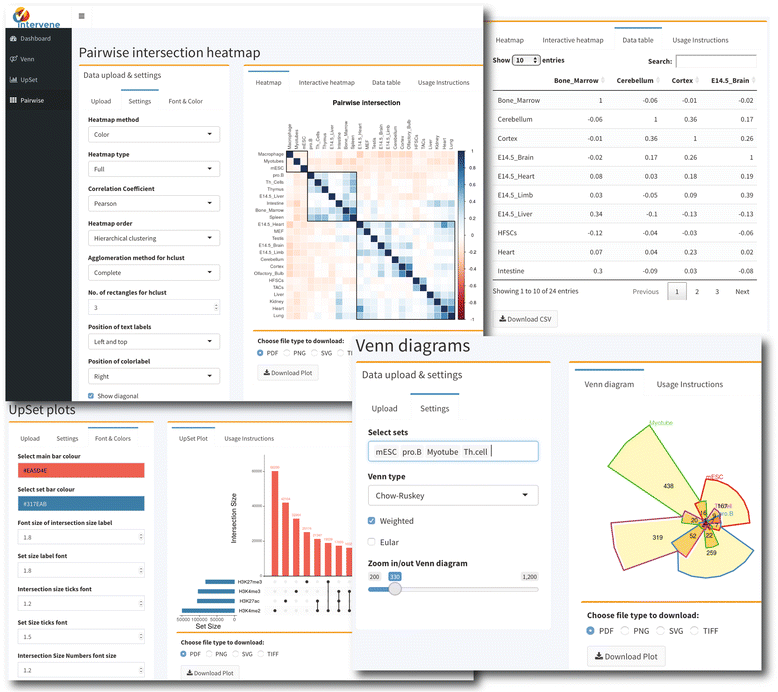
To address this gap, we have developed the Intervene tool, which provides an easy and automated interface for the effective intersection and visualization of genomic region or list sets, thus facilitating their analysis and interpretation. Intervene contains three modules: ''venn'' to generate Venn diagrams of up to six sets, ''upset'' to generate UpSet plots of multiple sets, and ''pairwise'' to compute and visualize intersections of multiple sets as clustered heat maps. Intervene, and its interactive web ShinyApp companion, generate publication-quality figures for the interpretation of genomic region and list sets. ('''[[Journal:Intervene: A tool for intersection and visualization of multiple gene or genomic region sets|Full article...]]''')<br /> | |||
</div> | |||
|- | |||
|<br /><h2 style="font-size:105%; font-weight:bold; text-align:left; color:#000; padding:0.2em 0.4em; width:50%;">Featured article of the week: July 24–30:</h2> | |||
<div style="padding:0.4em 1em 0.3em 1em;"> | |||
<div style="float: left; margin: 0.5em 0.9em 0.4em 0em;">[[File:Fig2 Buabbas JMIRMedInfo2016 4-2.png|240px]]</div> | |||
'''"[[Journal:Users’ perspectives on a picture archiving and communication system (PACS): An in-depth study in a teaching hospital in Kuwait|Users’ perspectives on a picture archiving and communication system (PACS): An in-depth study in a teaching hospital in Kuwait]]"''' | |||
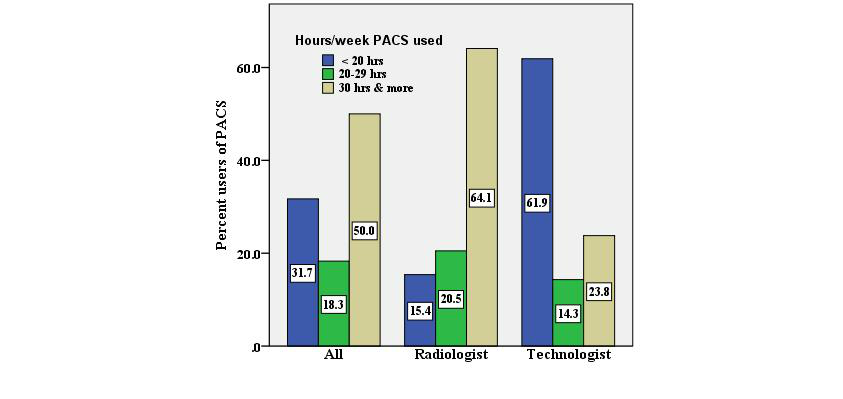
The [[picture archiving and communication system]] (PACS) is a well-known [[imaging informatics]] application in health care organizations, specifically designed for the radiology department. Health care providers have exhibited willingness toward evaluating PACS in hospitals to ascertain the critical success and failure of the technology, considering that evaluation is a basic requirement. | |||
This study aimed to evaluate the success of a PACS in a regional teaching hospital of Kuwait, from users’ perspectives, using information systems success criteria. | |||
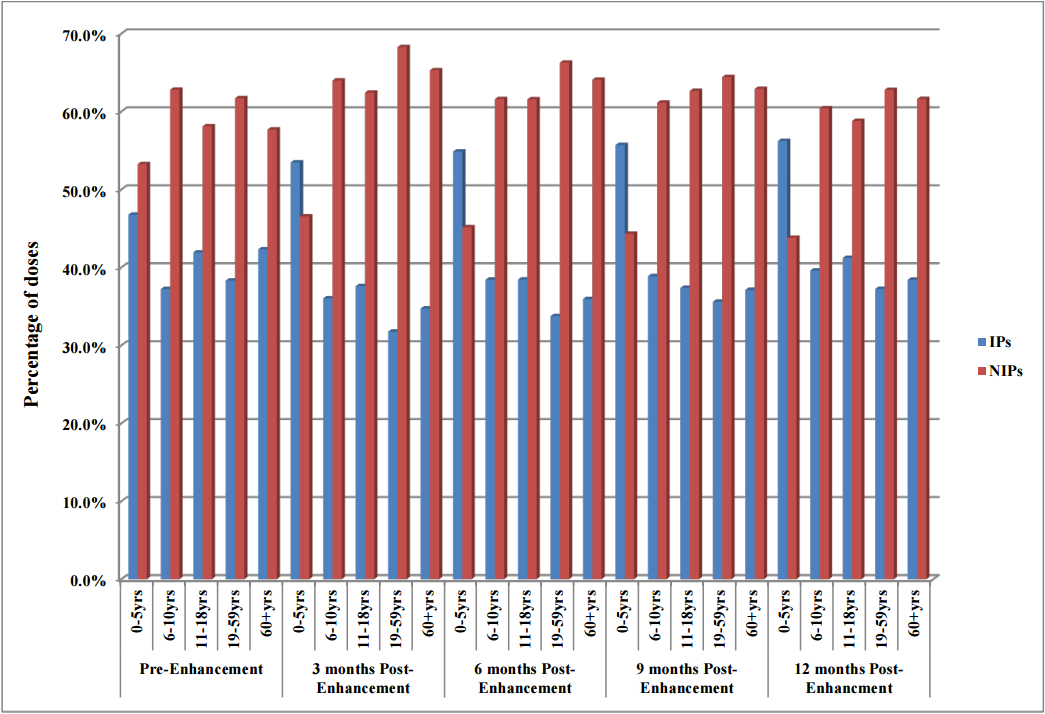
An in-depth study was conducted by using quantitative and qualitative methods. This mixed-method study was based on: (1) questionnaires, distributed to all radiologists and technologists and (2) interviews, conducted with PACS administrators. ('''[[Journal:Users’ perspectives on a picture archiving and communication system (PACS): An in-depth study in a teaching hospital in Kuwait|Full article...]]''')<br /> | |||
</div> | |||
|- | |||
|<br /><h2 style="font-size:105%; font-weight:bold; text-align:left; color:#000; padding:0.2em 0.4em; width:50%;">Featured article of the week: July 17–23:</h2> | |||
<div style="padding:0.4em 1em 0.3em 1em;"> | <div style="padding:0.4em 1em 0.3em 1em;"> | ||
<div style="float: left; margin: 0.5em 0.9em 0.4em 0em;">[[File:Fig1 Zheng JMIRMedInfo2017 5-2.png|240px]]</div> | <div style="float: left; margin: 0.5em 0.9em 0.4em 0em;">[[File:Fig1 Zheng JMIRMedInfo2017 5-2.png|240px]]</div> | ||
Latest revision as of 19:57, 3 April 2024
|
|
If you're looking for other "Article of the Week" archives: 2014 - 2015 - 2016 - 2017 - 2018 - 2019 - 2020 - 2021 - 2022 - 2023 - 2024 |
Featured article of the week archive - 2017
Welcome to the LIMSwiki 2017 archive for the Featured Article of the Week.
Featured article of the week: December 25–31:"Chemotion ELN: An open-source electronic lab notebook for chemists in academia" The development of an electronic laboratory notebook (ELN) for researchers working in the field of chemical sciences is presented. The web-based application is available as open-source software that offers modern solutions for chemical researchers. The Chemotion ELN is equipped with the basic functionalities necessary for the acquisition and processing of chemical data, in particular work with molecular structures and calculations based on molecular properties. The ELN supports planning, description, storage, and management for the routine work of organic chemists. It also provides tools for communicating and sharing the recorded research data among colleagues. Meeting the requirements of a state-of-the-art research infrastructure, the ELN allows the search for molecules and reactions not only within the user’s data but also in conventional external sources as provided by SciFinder and PubChem. The presented development makes allowance for the growing dependency of scientific activity on the availability of digital information by providing open- source instruments to record and reuse research data. The current version of the ELN has been used for over half of a year in our chemistry research group, serving as a common infrastructure for chemistry research and enabling chemistry researchers to build their own databases of digital information as a prerequisite for the detailed, systematic investigation and evaluation of chemical reactions and mechanisms. (Full article...)
|
