Difference between revisions of "Main Page/Featured article of the week/2016"
Shawndouglas (talk | contribs) (Added last week's article of the week.) |
Shawndouglas (talk | contribs) m (Text replacement - "\[\[Cerner Corporation(.*)" to "[[Vendor:Cerner Corporation$1") |
||
| (22 intermediate revisions by the same user not shown) | |||
| Line 1: | Line 1: | ||
{{ombox | {{ombox | ||
| type = notice | | type = notice | ||
| text = If you're looking for the | | text = If you're looking for other "Article of the Week" archives: [[Main Page/Featured article of the week/2014|2014]] - [[Main Page/Featured article of the week/2015|2015]] - 2016 - [[Main Page/Featured article of the week/2017|2017]] - [[Main Page/Featured article of the week/2018|2018]] - [[Main Page/Featured article of the week/2019|2019]] - [[Main Page/Featured article of the week/2020|2020]] - [[Main Page/Featured article of the week/2021|2021]] - [[Main Page/Featured article of the week/2022|2022]] - [[Main Page/Featured article of the week/2023|2023]] - [[Main Page/Featured article of the week/2024|2024]] | ||
}} | }} | ||
| Line 17: | Line 17: | ||
<!-- Below this line begin pasting previous news --> | <!-- Below this line begin pasting previous news --> | ||
<h2 style="font-size:105%; font-weight:bold; text-align:left; color:#000; padding:0.2em 0.4em; width:50%;">Featured article of the week: September | <h2 style="font-size:105%; font-weight:bold; text-align:left; color:#000; padding:0.2em 0.4em; width:50%;">Featured article of the week: December 19–25:</h2> | ||
<div style="padding:0.4em 1em 0.3em 1em;"> | |||
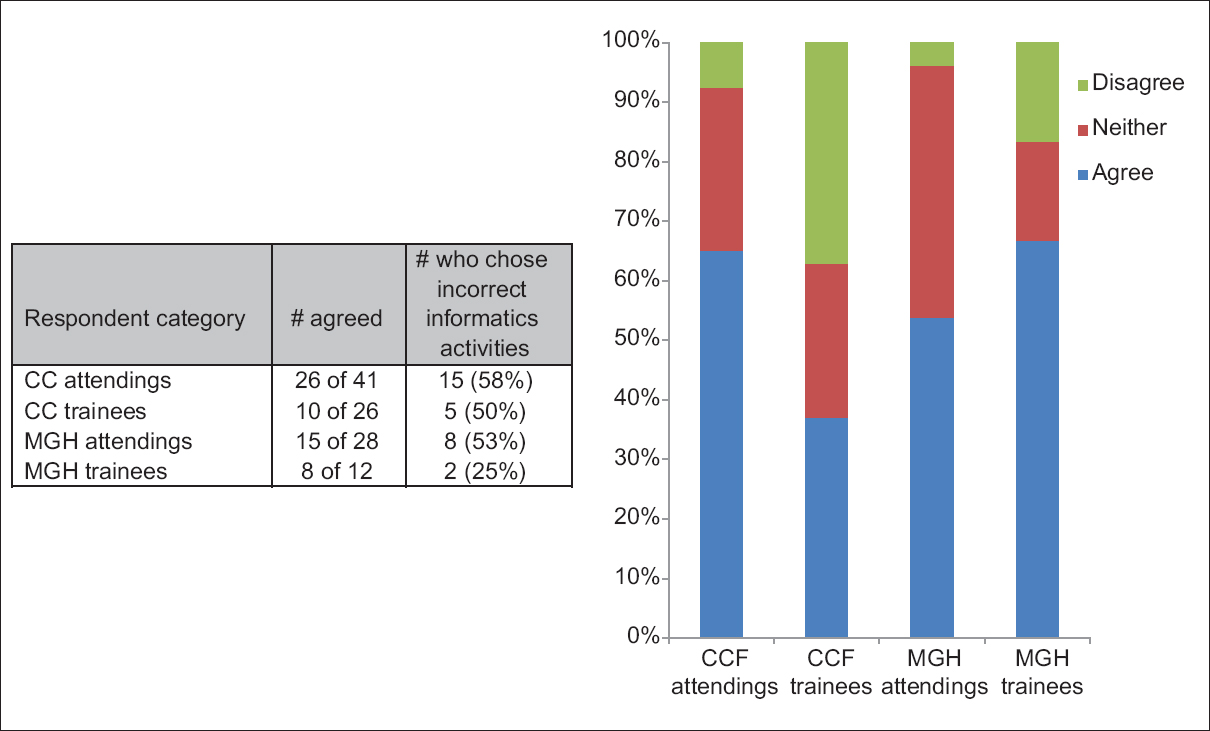
<div style="float: left; margin: 0.5em 0.9em 0.4em 0em;">[[File:Fig1 Mackert JournalOfMedIntRes2016 18-10.png|240px]]</div> | |||
'''"[[Journal:Health literacy and health information technology adoption: The potential for a new digital divide|Health literacy and health information technology adoption: The potential for a new digital divide]]"''' | |||
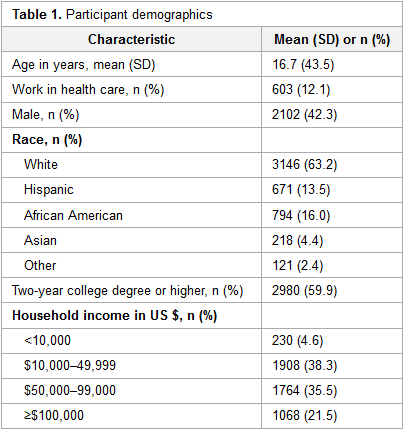
Approximately one-half of American adults exhibit low health literacy and thus struggle to find and use [[Health informatics|health information]]. Low health literacy is associated with negative outcomes, including overall poorer health. [[Health information technology]] (HIT) makes health information available directly to patients through electronic tools including [[patient portal]]s, wearable technology, and mobile apps. The direct availability of this [[information]] to patients, however, may be complicated by misunderstanding of HIT privacy and information sharing. The purpose of this study was to determine whether health literacy is associated with patients’ use of four types of HIT tools: fitness and nutrition apps, activity trackers, and patient portals. ('''[[Journal:Health literacy and health information technology adoption: The potential for a new digital divide|Full article...]]''')<br /> | |||
</div> | |||
|- | |||
|<br /><h2 style="font-size:105%; font-weight:bold; text-align:left; color:#000; padding:0.2em 0.4em; width:50%;">Featured article of the week: December 12–18:</h2> | |||
<div style="padding:0.4em 1em 0.3em 1em;"> | |||
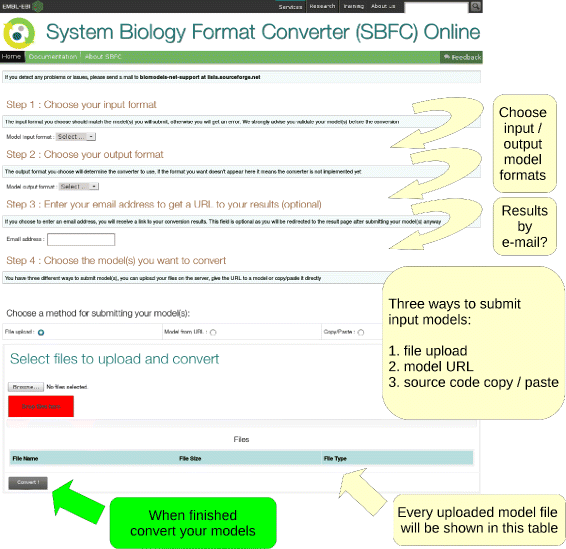
<div style="float: left; margin: 0.5em 0.9em 0.4em 0em;">[[File:Fig2 Lam BMCBioinformatics2016 17.gif|240px]]</div> | |||
'''"[[Journal:VennDiagramWeb: A web application for the generation of highly customizable Venn and Euler diagrams|VennDiagramWeb: A web application for the generation of highly customizable Venn and Euler diagrams]]"''' | |||
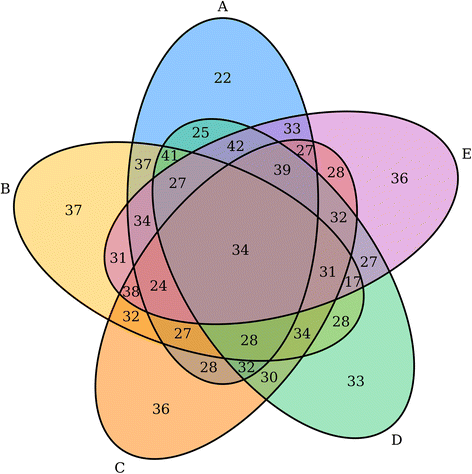
Visualization of data generated by high-throughput, high-dimensionality experiments is rapidly becoming a rate-limiting step in [[Computational informatics|computational biology]]. There is an ongoing need to quickly develop high-quality visualizations that can be easily customized or incorporated into automated pipelines. This often requires an interface for manual plot modification, rapid cycles of tweaking visualization parameters, and the generation of graphics code. To facilitate this process for the generation of highly-customizable, high-resolution Venn and Euler diagrams, we introduce ''VennDiagramWeb'': a web application for the widely used VennDiagram R package. ('''[[Journal:VennDiagramWeb: A web application for the generation of highly customizable Venn and Euler diagrams|Full article...]]''')<br /> | |||
</div> | |||
|- | |||
|<br /><h2 style="font-size:105%; font-weight:bold; text-align:left; color:#000; padding:0.2em 0.4em; width:50%;">Featured article of the week: December 5–11:</h2> | |||
<div style="padding:0.4em 1em 0.3em 1em;"> | |||
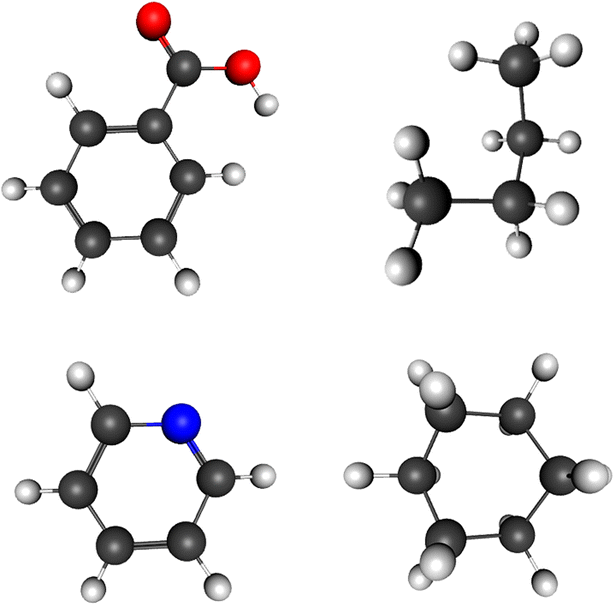
<div style="float: left; margin: 0.5em 0.9em 0.4em 0em;">[[File:Fig2 Bekker JofCheminformatics2016 8-1.gif|240px]]</div> | |||
'''"[[Journal:Molmil: A molecular viewer for the PDB and beyond|Molmil: A molecular viewer for the PDB and beyond]]"''' | |||
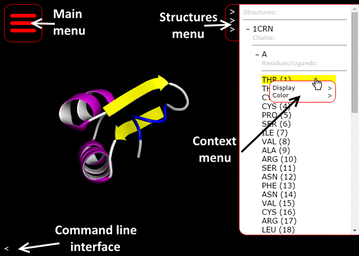
Molecular viewers are a vital tool for our understanding of protein structures and functions. The shift from regular desktop platforms such as Windows, Mac OSX and Linux to mobile platforms such as iOS and Android in the last half-decade, however, prevents traditional online molecular viewers such as PDBj’s previously developed jV and the popular Jmol from running on these new platforms as these platforms do not support Java Applets. For mobile platforms a native application (i.e., an application specifically designed and optimized for each of these platforms) can be created and distributed via their respective application stores. However, with new platforms on the horizon, or already available, in addition to the already established desktop platforms, it would be a tedious and inefficient job to make a molecular viewer available on all platforms, current and future. ('''[[Journal:Molmil: A molecular viewer for the PDB and beyond|Full article...]]''')<br /> | |||
</div> | |||
|- | |||
|<br /><h2 style="font-size:105%; font-weight:bold; text-align:left; color:#000; padding:0.2em 0.4em; width:50%;">Featured article of the week: November 28–December 4:</h2> | |||
<div style="padding:0.4em 1em 0.3em 1em;"> | |||
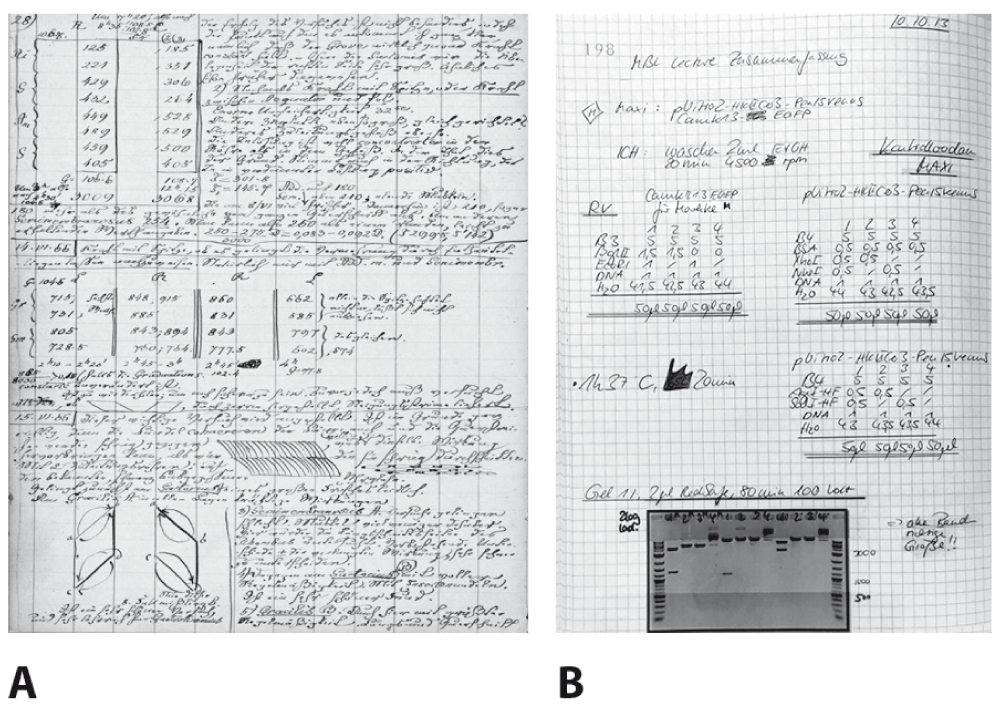
<div style="float: left; margin: 0.5em 0.9em 0.4em 0em;">[[File:Fig1 Gates JofResearchNIST2015 120.jpg|240px]]</div> | |||
'''"[[Journal:Smart electronic laboratory notebooks for the NIST research environment|Smart electronic laboratory notebooks for the NIST research environment]]"''' | |||
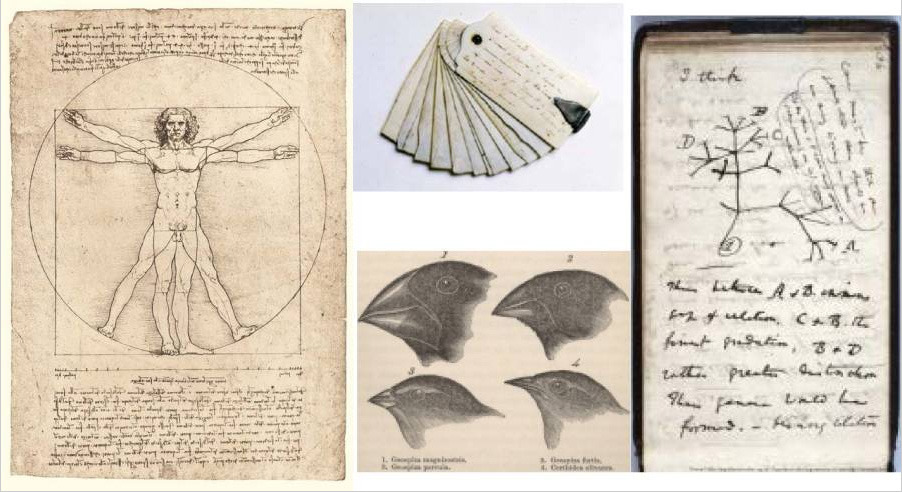
[[Laboratory notebook]]s have been a staple of scientific research for centuries for organizing and documenting ideas and experiments. Modern [[Laboratory|laboratories]] are increasingly reliant on electronic data collection and analysis, so it seems inevitable that the digital revolution should come to the ordinary laboratory notebook. The most important aspect of this transition is to make the shift as comfortable and intuitive as possible, so that the creative process that is the hallmark of scientific investigation and engineering achievement is maintained, and ideally enhanced. The smart [[electronic laboratory notebook]]s described in this paper represent a paradigm shift from the old pen and paper style notebooks and provide a host of powerful operational and documentation capabilities in an intuitive format that is available anywhere at any time. ('''[[Journal:Smart electronic laboratory notebooks for the NIST research environment|Full article...]]''')<br /> | |||
</div> | |||
|- | |||
|<br /><h2 style="font-size:105%; font-weight:bold; text-align:left; color:#000; padding:0.2em 0.4em; width:50%;">Featured article of the week: November 21–27:</h2> | |||
<div style="padding:0.4em 1em 0.3em 1em;"> | |||
<div style="float: left; margin: 0.5em 0.9em 0.4em 0em;">[[File:Fig1 Goldberg mBio2015 6-6.jpg|240px]]</div> | |||
'''"[[Journal:Making the leap from research laboratory to clinic: Challenges and opportunities for next-generation sequencing in infectious disease diagnostics|Making the leap from research laboratory to clinic: Challenges and opportunities for next-generation sequencing in infectious disease diagnostics]]"''' | |||
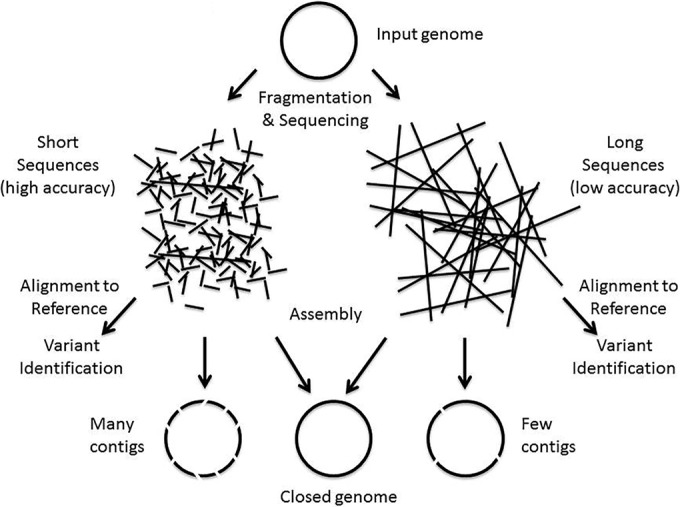
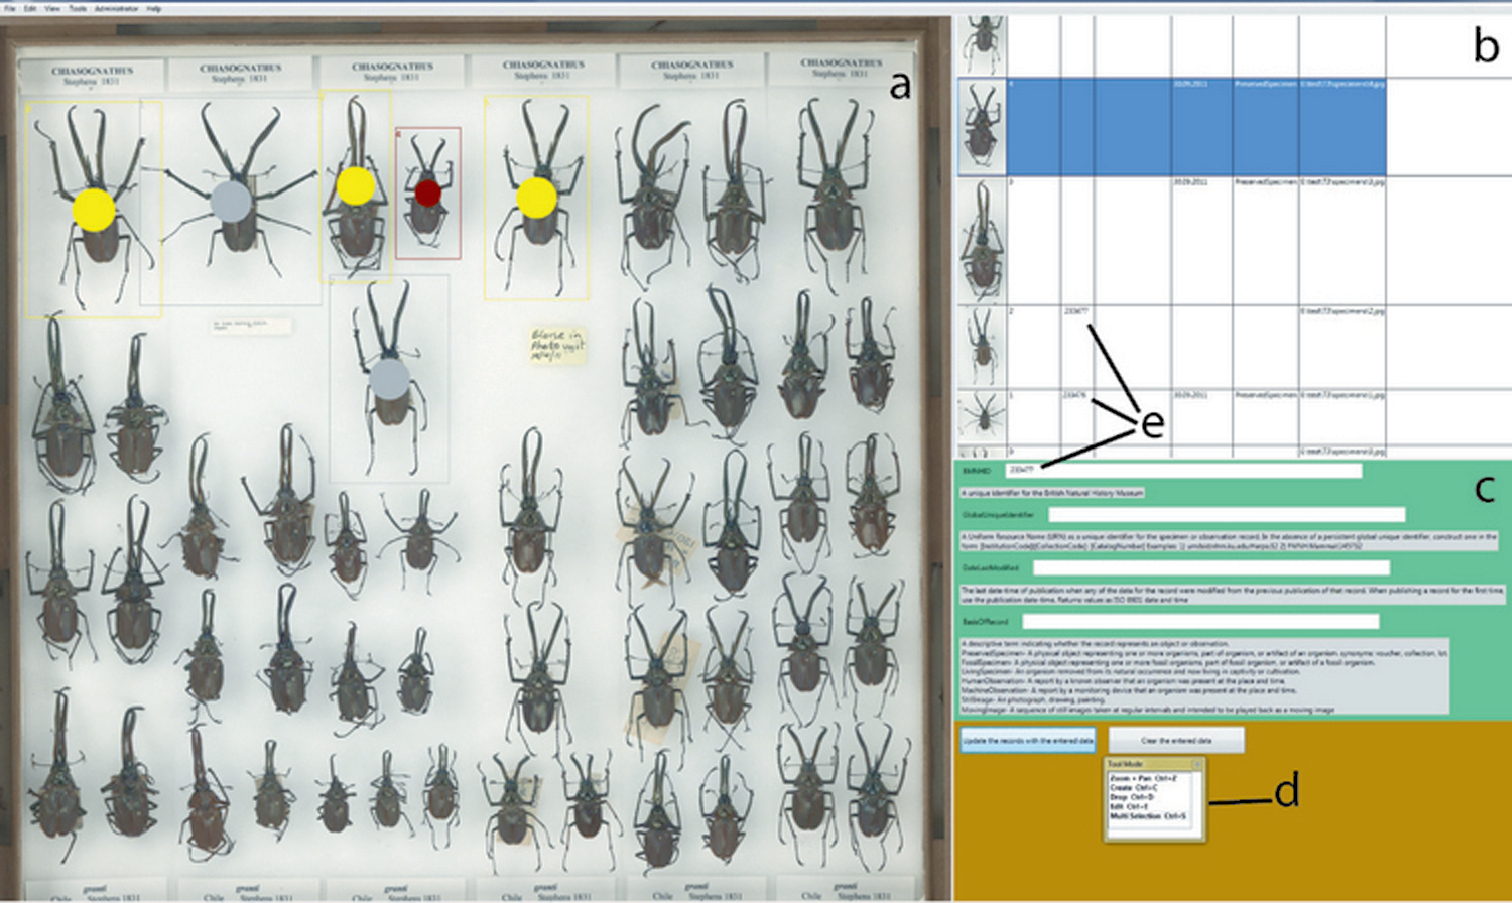
Next-generation DNA sequencing (NGS) has progressed enormously over the past decade, transforming [[Genomics|genomic]] analysis and opening up many new opportunities for applications in clinical microbiology [[Laboratory|laboratories]]. The impact of NGS on microbiology has been revolutionary, with new microbial genomic sequences being generated daily, leading to the development of large databases of genomes and gene sequences. The ability to analyze microbial communities without culturing organisms has created the ever-growing field of metagenomics and microbiome analysis and has generated significant new insights into the relation between host and microbe. The medical literature contains many examples of how this new technology can be used for infectious disease diagnostics and pathogen analysis. The implementation of NGS in medical practice has been a slow process due to various challenges such as clinical trials, lack of applicable regulatory guidelines, and the adaptation of the technology to the clinical environment. In April 2015, the American Academy of Microbiology (AAM) convened a colloquium to begin to define these issues, and in this document, we present some of the concepts that were generated from these discussions. ('''[[Journal:Making the leap from research laboratory to clinic: Challenges and opportunities for next-generation sequencing in infectious disease diagnostics|Full article...]]''')<br /> | |||
</div> | |||
|- | |||
|<br /><h2 style="font-size:105%; font-weight:bold; text-align:left; color:#000; padding:0.2em 0.4em; width:50%;">Featured article of the week: November 14–20:</h2> | |||
<div style="padding:0.4em 1em 0.3em 1em;"> | |||
<div style="float: left; margin: 0.5em 0.9em 0.4em 0em;">[[File:Fig1 Aronson JournalOfPersMed2016 6-1.png|240px]]</div> | |||
'''"[[Journal:Information technology support for clinical genetic testing within an academic medical center|Information technology support for clinical genetic testing within an academic medical center]]"''' | |||
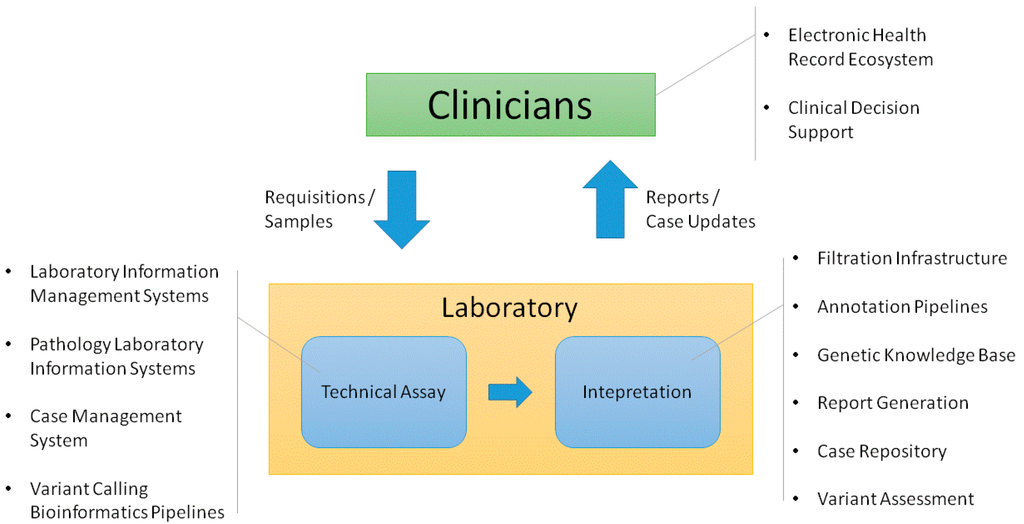
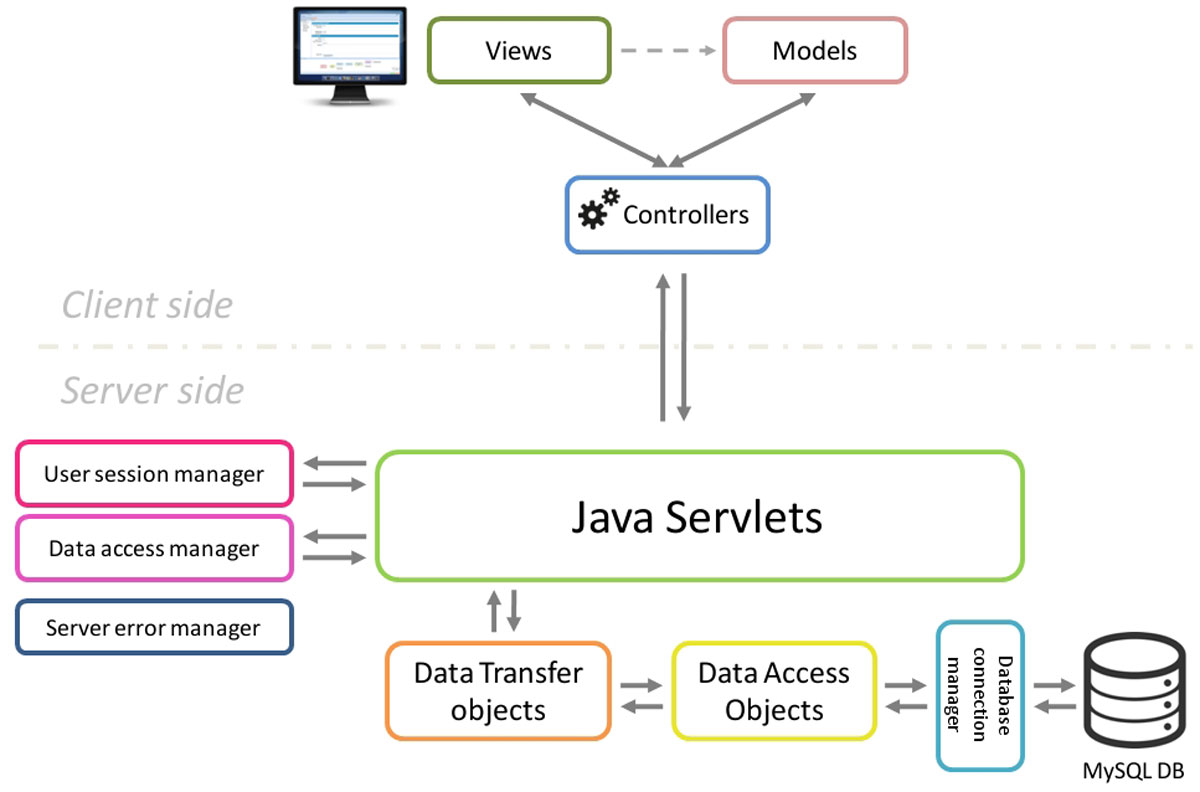
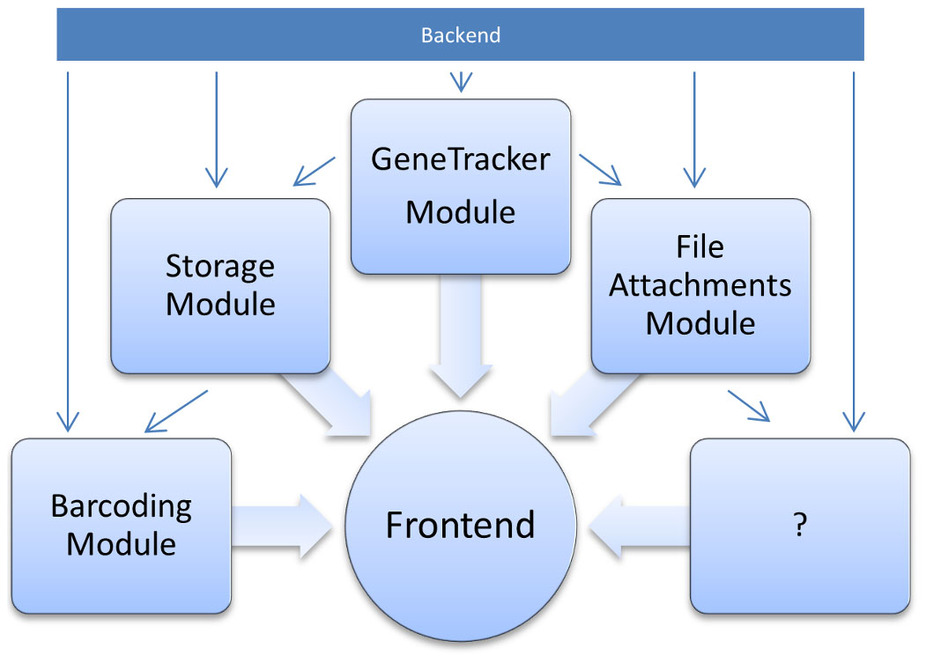
Academic medical centers require many interconnected systems to fully support genetic testing processes. We provide an overview of the end-to-end support that has been established surrounding a genetic testing laboratory within our environment, including both [[laboratory]] and clinician-facing infrastructure. We explain key functions that we have found useful in the supporting systems. We also consider ways that this infrastructure could be enhanced to enable deeper assessment of genetic test results in both the laboratory and clinic. ('''[[Journal:Information technology support for clinical genetic testing within an academic medical center|Full article...]]''')<br /> | |||
</div> | |||
|- | |||
|<br /><h2 style="font-size:105%; font-weight:bold; text-align:left; color:#000; padding:0.2em 0.4em; width:50%;">Featured article of the week: November 07–13:</h2> | |||
<div style="padding:0.4em 1em 0.3em 1em;"> | |||
<div style="float: left; margin: 0.5em 0.9em 0.4em 0em;">[[File:Fig1 Hong Database2016 2016.jpg|240px]]</div> | |||
'''"[[Journal:Principles of metadata organization at the ENCODE data coordination center|Principles of metadata organization at the ENCODE data coordination center]]"''' | |||
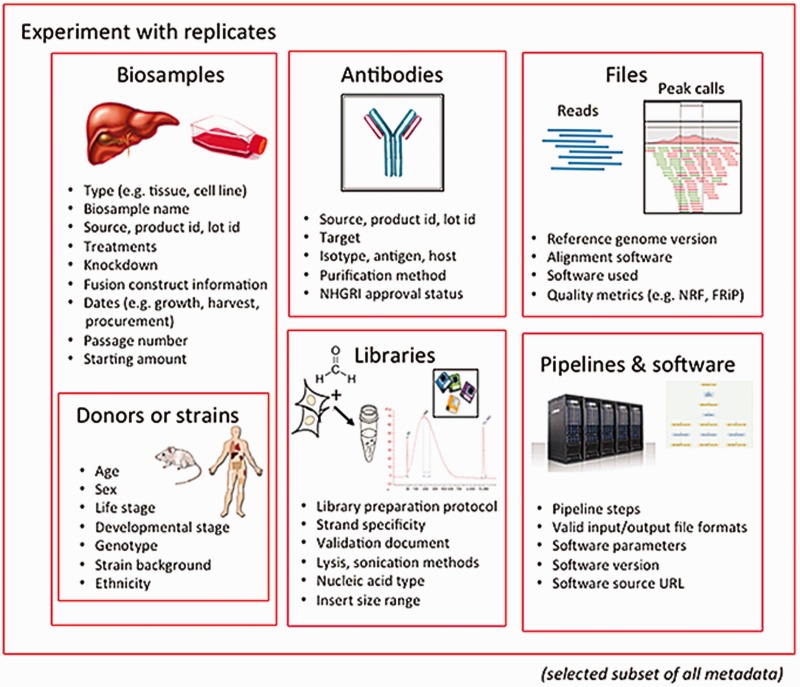
The Encyclopedia of DNA Elements (ENCODE) Data Coordinating Center (DCC) is responsible for organizing, describing and providing access to the diverse data generated by the ENCODE project. The description of these data, known as metadata, includes the biological sample used as input, the protocols and assays performed on these samples, the data files generated from the results and the computational methods used to analyze the data. Here, we outline the principles and philosophy used to define the ENCODE metadata in order to create a metadata standard that can be applied to diverse assays and multiple genomic projects. In addition, we present how the data are validated and used by the ENCODE DCC in creating the ENCODE Portal. ('''[[Journal:Principles of metadata organization at the ENCODE data coordination center|Full article...]]''')<br /> | |||
</div> | |||
|- | |||
|<br /><h2 style="font-size:105%; font-weight:bold; text-align:left; color:#000; padding:0.2em 0.4em; width:50%;">Featured article of the week: October 31–November 06:</h2> | |||
<div style="padding:0.4em 1em 0.3em 1em;"> | |||
<div style="float: left; margin: 0.5em 0.9em 0.4em 0em;">[[File:Fig1 Bianchi FrontinGenetics2016 7.jpg|240px]]</div> | |||
'''"[[Journal:Integrated systems for NGS data management and analysis: Open issues and available solutions|Integrated systems for NGS data management and analysis: Open issues and available solutions]]"''' | |||
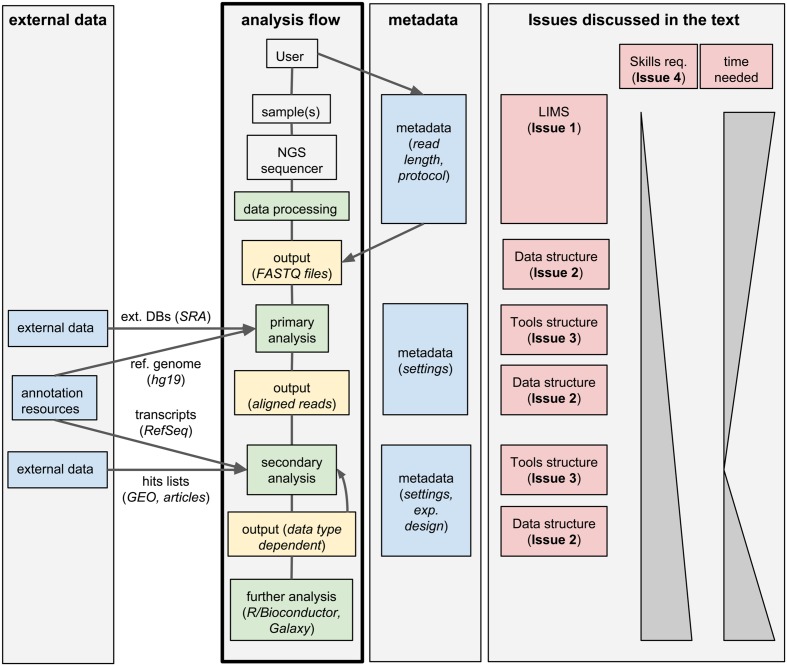
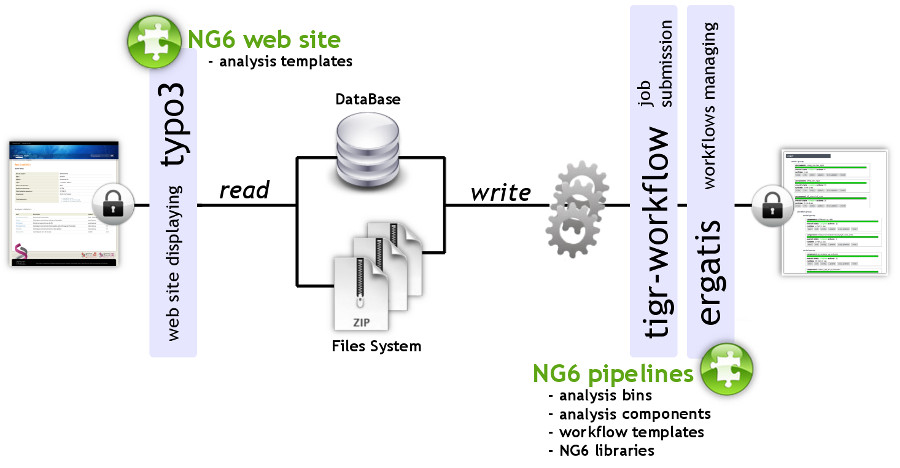
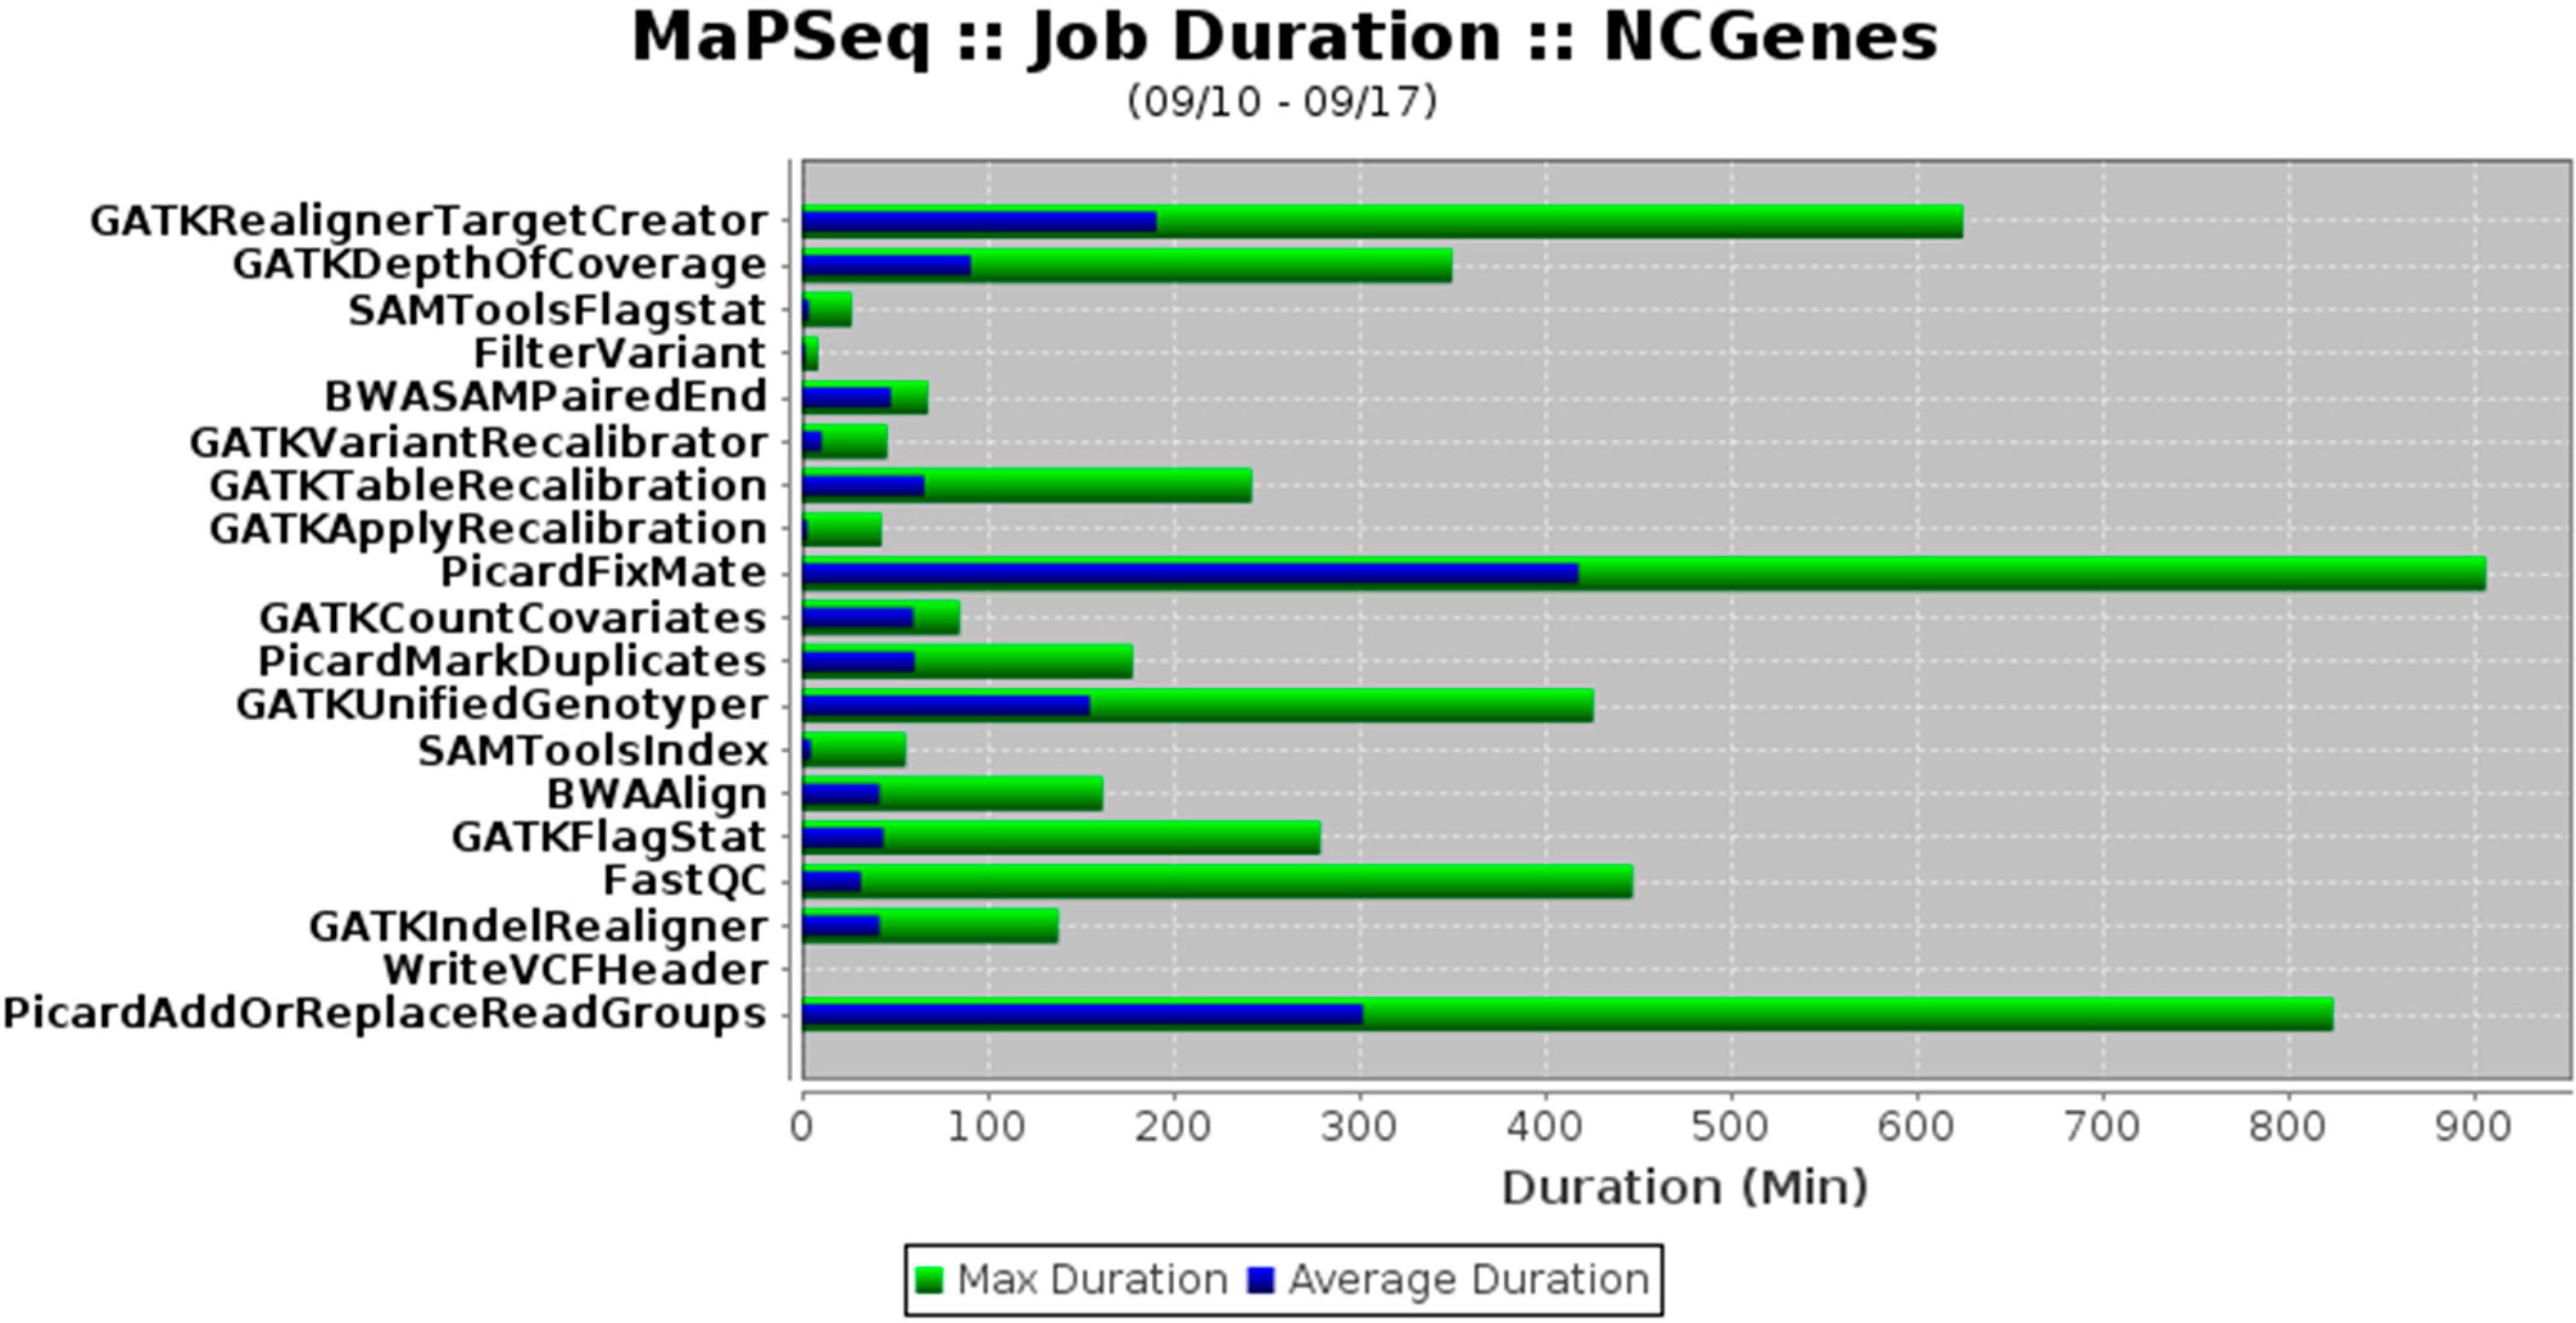
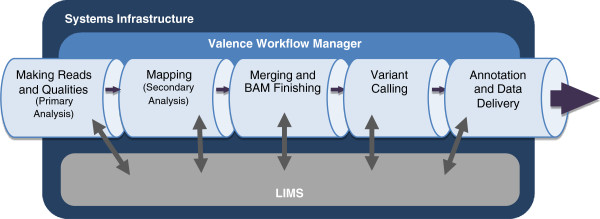
Next-generation sequencing (NGS) technologies have deeply changed our understanding of cellular processes by delivering an astonishing amount of data at affordable prices; nowadays, many biology [[laboratory|laboratories]] have already accumulated a large number of sequenced samples. However, managing and analyzing these data poses new challenges, which may easily be underestimated by research groups devoid of IT and quantitative skills. In this perspective, we identify five issues that should be carefully addressed by research groups approaching NGS technologies. In particular, the five key issues to be considered concern: (1) adopting a [[laboratory information management system]] (LIMS) and safeguard the resulting raw data structure in downstream analyses; (2) monitoring the flow of the data and standardizing input and output directories and file names, even when multiple analysis protocols are used on the same data; (3) ensuring complete traceability of the analysis performed; (4) enabling non-experienced users to run analyses through a graphical user interface (GUI) acting as a front-end for the pipelines; (5) relying on standard metadata to annotate the datasets, and when possible using controlled vocabularies, ideally derived from biomedical ontologies. ('''[[Journal:Integrated systems for NGS data management and analysis: Open issues and available solutions|Full article...]]''')<br /> | |||
</div> | |||
|- | |||
|<br /><h2 style="font-size:105%; font-weight:bold; text-align:left; color:#000; padding:0.2em 0.4em; width:50%;">Featured article of the week: October 24–30:</h2> | |||
<div style="padding:0.4em 1em 0.3em 1em;"> | |||
<div style="float: left; margin: 0.5em 0.9em 0.4em 0em;">[[File:Fig1 Naulaerts BioAndBioInsights2016 10.png|240px]]</div> | |||
'''"[[Journal:Practical approaches for mining frequent patterns in molecular datasets|Practical approaches for mining frequent patterns in molecular datasets]]"''' | |||
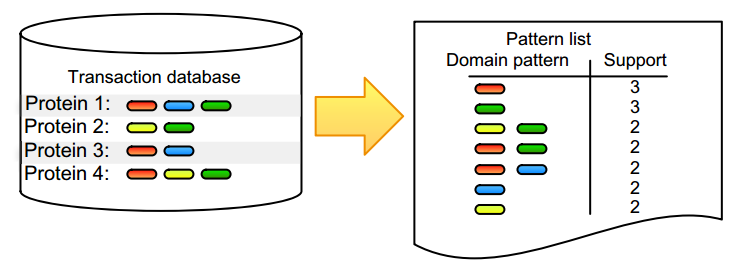
Pattern detection is an inherent task in the analysis and interpretation of complex and continuously accumulating biological data. Numerous [[wikipedia:Sequential pattern mining|itemset mining]] algorithms have been developed in the last decade to efficiently detect specific pattern classes in data. Although many of these have proven their value for addressing bioinformatics problems, several factors still slow down promising algorithms from gaining popularity in the life science community. Many of these issues stem from the low user-friendliness of these tools and the complexity of their output, which is often large, static, and consequently hard to interpret. Here, we apply three software implementations on common [[bioinformatics]] problems and illustrate some of the advantages and disadvantages of each, as well as inherent pitfalls of biological data mining. Frequent itemset mining exists in many different flavors, and users should decide their software choice based on their research question, programming proficiency, and added value of extra features. ('''[[Journal:Practical approaches for mining frequent patterns in molecular datasets|Full article...]]''')<br /> | |||
</div> | |||
|- | |||
|<br /><h2 style="font-size:105%; font-weight:bold; text-align:left; color:#000; padding:0.2em 0.4em; width:50%;">Featured article of the week: October 17–23:</h2> | |||
<div style="padding:0.4em 1em 0.3em 1em;"> | |||
<div style="float: left; margin: 0.5em 0.9em 0.4em 0em;">[[File:Fig1 Cervin JofPathInfo2016 7.jpg|240px]]</div> | |||
'''"[[Journal:Improving the creation and reporting of structured findings during digital pathology review|Improving the creation and reporting of structured findings during digital pathology review]]"''' | |||
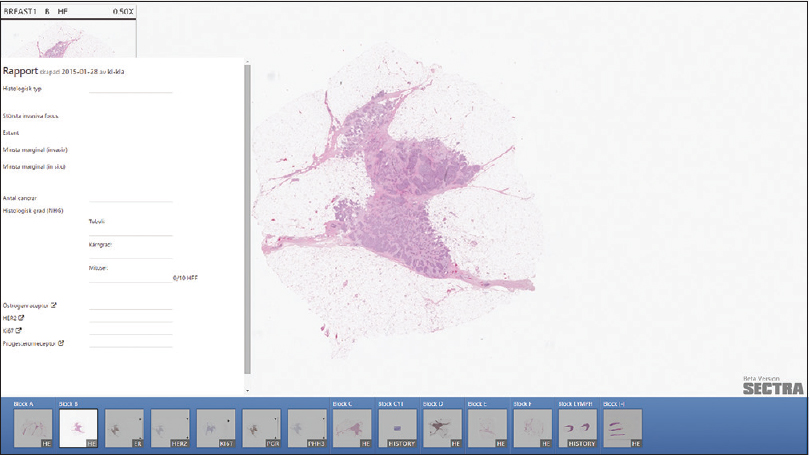
Today, pathology reporting consists of many separate tasks, carried out by multiple people. Common tasks include dictation during case review, transcription, verification of the transcription, report distribution, and reporting the key findings to follow-up registries. Introduction of digital workstations makes it possible to remove some of these tasks and simplify others. This study describes the work presented at the Nordic Symposium on Digital Pathology 2015, in Linköping, Sweden. | |||
We explored the possibility of having a digital tool that simplifies image review by assisting note-taking, and with minimal extra effort, populates a structured report. Thus, our prototype sees reporting as an activity interleaved with image review rather than a separate final step. We created an interface to collect, sort, and display findings for the most common reporting needs, such as tumor size, grading, and scoring. ('''[[Journal:Improving the creation and reporting of structured findings during digital pathology review|Full article...]]''')<br /> | |||
</div> | |||
|- | |||
|<br /><h2 style="font-size:105%; font-weight:bold; text-align:left; color:#000; padding:0.2em 0.4em; width:50%;">Featured article of the week: October 10–16:</h2> | |||
<div style="padding:0.4em 1em 0.3em 1em;"> | |||
<div style="float: left; margin: 0.5em 0.9em 0.4em 0em;">[[File:Fig1 Cai DataScienceJournal2015 14.png|240px]]</div> | |||
'''"[[Journal:The challenges of data quality and data quality assessment in the big data era|The challenges of data quality and data quality assessment in the big data era]]"''' | |||
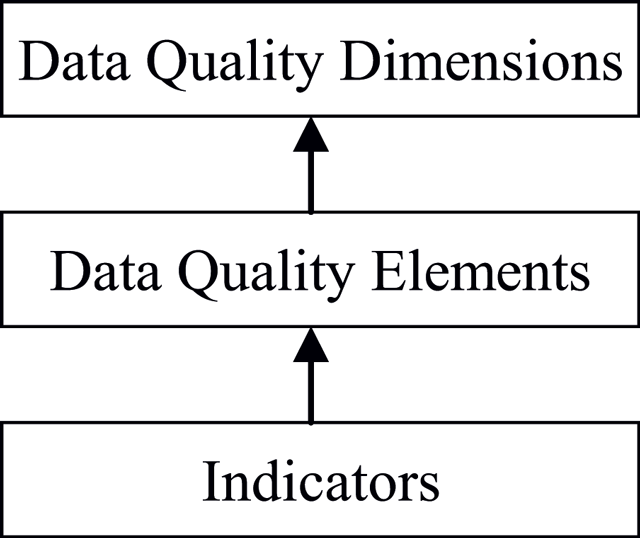
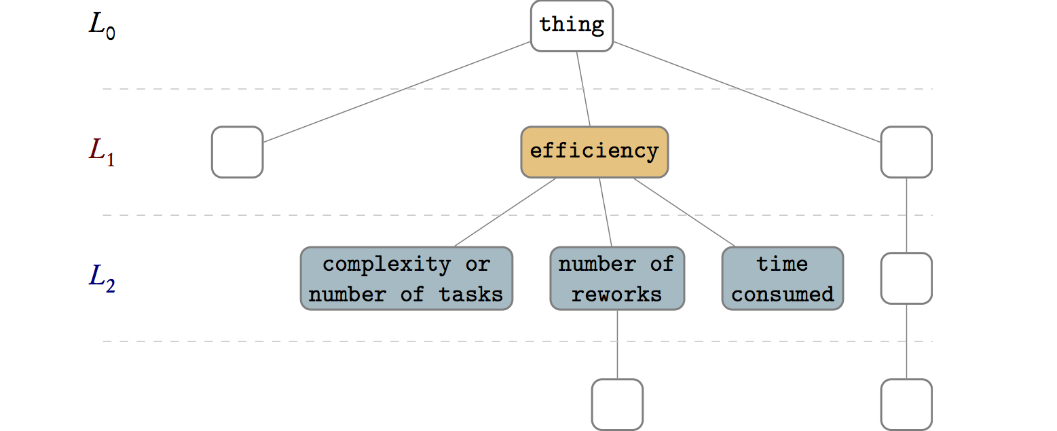
High-quality data are the precondition for analyzing and using big data and for guaranteeing the value of the data. Currently, comprehensive analysis and research of quality standards and quality assessment methods for big data are lacking. First, this paper summarizes reviews of data quality research. Second, this paper analyzes the data characteristics of the big data environment, presents quality challenges faced by big data, and formulates a hierarchical data quality framework from the perspective of data users. This framework consists of big data quality dimensions, quality characteristics, and quality indexes. Finally, on the basis of this framework, this paper constructs a dynamic assessment process for data quality. This process has good expansibility and adaptability and can meet the needs of big data quality assessment. The research results enrich the theoretical scope of big data and lay a solid foundation for the future by establishing an assessment model and studying evaluation algorithms. ('''[[Journal:The challenges of data quality and data quality assessment in the big data era|Full article...]]''')<br /> | |||
</div> | |||
|- | |||
|<br /><h2 style="font-size:105%; font-weight:bold; text-align:left; color:#000; padding:0.2em 0.4em; width:50%;">Featured article of the week: October 3–9:</h2> | |||
<div style="padding:0.4em 1em 0.3em 1em;"> | |||
<div style="float: left; margin: 0.5em 0.9em 0.4em 0em;">[[File:Journal.pone.0147942.g002.PNG|240px]]</div> | |||
'''"[[Journal:Water, water, everywhere: Defining and assessing data sharing in academia|Water, water, everywhere: Defining and assessing data sharing in academia]]"''' | |||
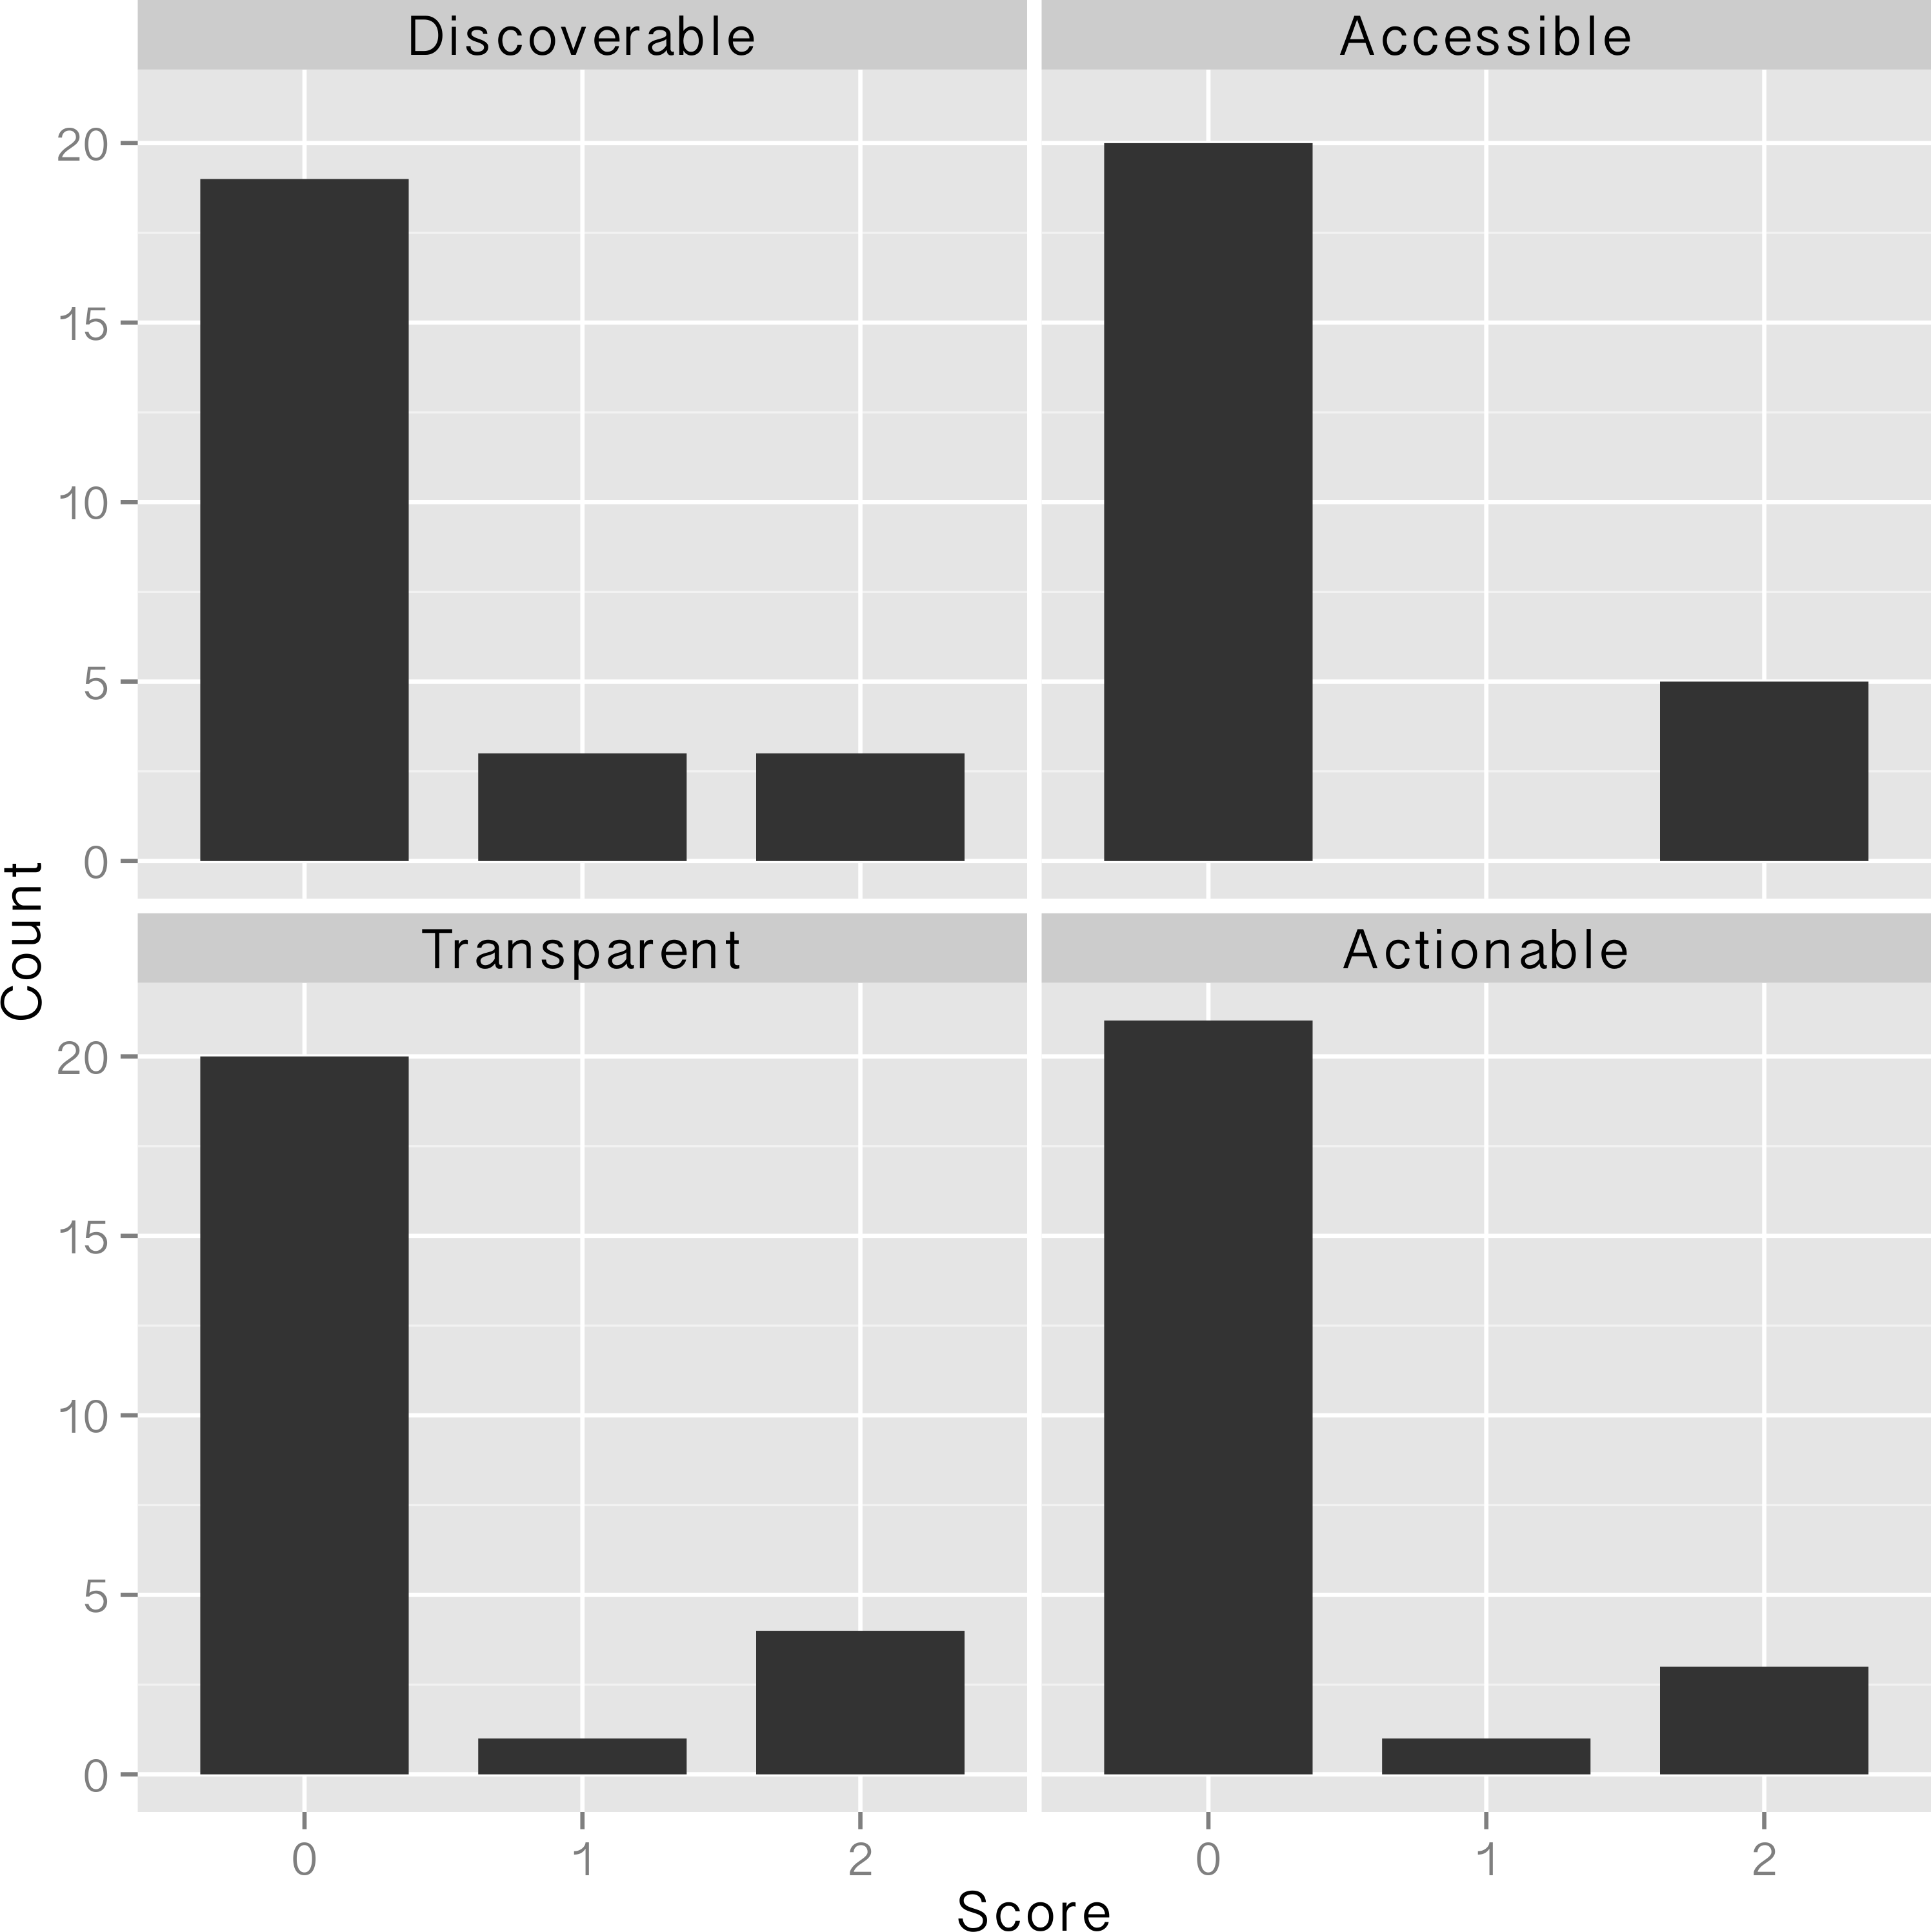
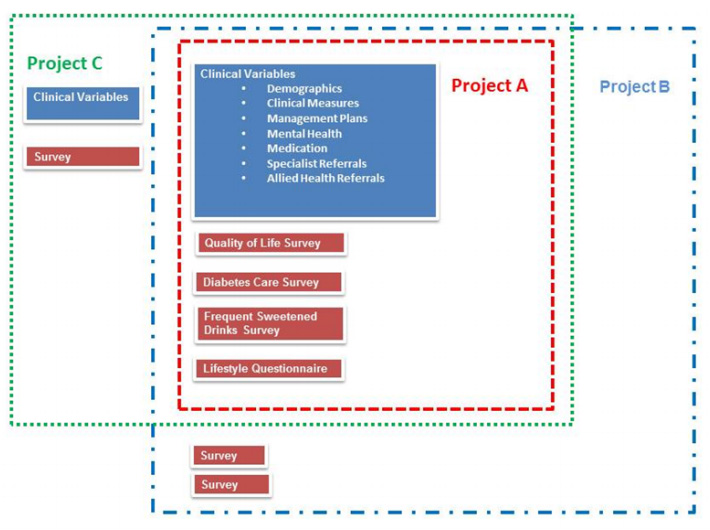
Sharing of research data has begun to gain traction in many areas of the sciences in the past few years because of changing expectations from the scientific community, funding agencies, and academic journals. National Science Foundation (NSF) requirements for a data management plan (DMP) went into effect in 2011, with the intent of facilitating the dissemination and sharing of research results. Many projects that were funded during 2011 and 2012 should now have implemented the elements of the data management plans required for their grant proposals. In this paper we define "data sharing" and present a protocol for assessing whether data have been shared and how effective the sharing was. We then evaluate the data sharing practices of researchers funded by the NSF at Oregon State University in two ways: by attempting to discover project-level research data using the associated DMP as a starting point, and by examining data sharing associated with journal articles that acknowledge NSF support. Sharing at both the project level and the journal article level was not carried out in the majority of cases, and when sharing was accomplished, the shared data were often of questionable usability due to access, documentation, and formatting issues. We close the article by offering recommendations for how data producers, journal publishers, data repositories, and funding agencies can facilitate the process of sharing data in a meaningful way. ('''[[Journal:Water, water, everywhere: Defining and assessing data sharing in academia|Full article...]]''')<br /> | |||
</div> | |||
|- | |||
|<br /><h2 style="font-size:105%; font-weight:bold; text-align:left; color:#000; padding:0.2em 0.4em; width:50%;">Featured article of the week: September 26–October 2:</h2> | |||
<div style="padding:0.4em 1em 0.3em 1em;"> | <div style="padding:0.4em 1em 0.3em 1em;"> | ||
<div style="float: left; margin: 0.5em 0.9em 0.4em 0em;">[[File:Fig2 Maier MammalianGenome2015 26-9.gif|240px]]</div> | <div style="float: left; margin: 0.5em 0.9em 0.4em 0em;">[[File:Fig2 Maier MammalianGenome2015 26-9.gif|240px]]</div> | ||
| Line 25: | Line 123: | ||
</div> | </div> | ||
|- | |- | ||
|<br /><h2 style="font-size:105%; font-weight:bold; text-align:left; color:#000; padding:0.2em 0.4em; width:50%;">Featured article of the week: September | |<br /><h2 style="font-size:105%; font-weight:bold; text-align:left; color:#000; padding:0.2em 0.4em; width:50%;">Featured article of the week: September 19–25:</h2> | ||
<div style="padding:0.4em 1em 0.3em 1em;"> | <div style="padding:0.4em 1em 0.3em 1em;"> | ||
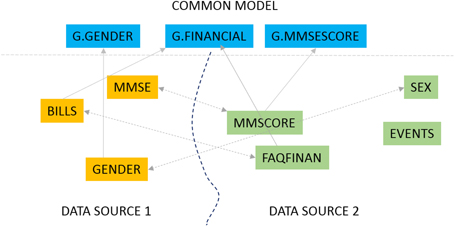
<div style="float: left; margin: 0.5em 0.9em 0.4em 0em;">[[File:Fig1 Hussain AppliedCompInfo2016.jpg|240px]]</div> | <div style="float: left; margin: 0.5em 0.9em 0.4em 0em;">[[File:Fig1 Hussain AppliedCompInfo2016.jpg|240px]]</div> | ||
| Line 128: | Line 226: | ||
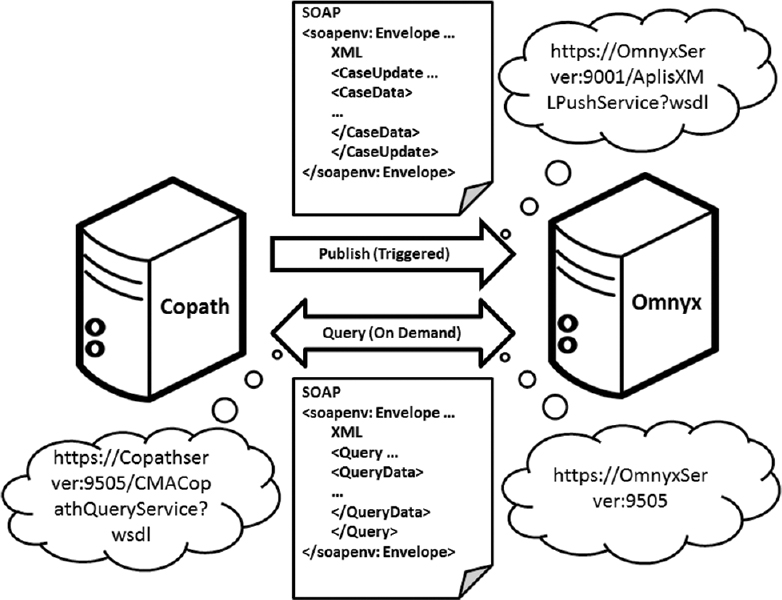
The adoption of digital pathology offers benefits over labor-intensive, time-consuming, and error-prone manual processes. However, because most workflow and [[laboratory]] transactions are centered around the anatomical pathology laboratory information system (APLIS), adoption of digital pathology ideally requires integration with the APLIS. A digital pathology system (DPS) integrated with the APLIS was recently implemented at our institution for diagnostic use. We demonstrate how such integration supports digital workflow to sign-out anatomical pathology cases. | The adoption of digital pathology offers benefits over labor-intensive, time-consuming, and error-prone manual processes. However, because most workflow and [[laboratory]] transactions are centered around the anatomical pathology laboratory information system (APLIS), adoption of digital pathology ideally requires integration with the APLIS. A digital pathology system (DPS) integrated with the APLIS was recently implemented at our institution for diagnostic use. We demonstrate how such integration supports digital workflow to sign-out anatomical pathology cases. | ||
Workflow begins when pathology cases get accessioned into the APLIS ([[Cerner Corporation|CoPathPlus]]). Glass slides from these cases are then digitized (Omnyx VL120 scanner) and automatically uploaded into the DPS (Omnyx; Integrated Digital Pathology (IDP) software v.1.3). The APLIS transmits case data to the DPS via a publishing web service. The DPS associates scanned images with the correct case using barcode labels on slides and information received from the APLIS. When pathologists remotely open a case in the DPS, additional information (e.g. gross pathology details, prior cases) gets retrieved from the APLIS through a query web service. ('''[[Journal:Digital pathology and anatomic pathology laboratory information system integration to support digital pathology sign-out|Full article...]]''')<br /> | Workflow begins when pathology cases get accessioned into the APLIS ([[Vendor:Cerner Corporation|CoPathPlus]]). Glass slides from these cases are then digitized (Omnyx VL120 scanner) and automatically uploaded into the DPS (Omnyx; Integrated Digital Pathology (IDP) software v.1.3). The APLIS transmits case data to the DPS via a publishing web service. The DPS associates scanned images with the correct case using barcode labels on slides and information received from the APLIS. When pathologists remotely open a case in the DPS, additional information (e.g. gross pathology details, prior cases) gets retrieved from the APLIS through a query web service. ('''[[Journal:Digital pathology and anatomic pathology laboratory information system integration to support digital pathology sign-out|Full article...]]''')<br /> | ||
</div> | </div> | ||
|- | |- | ||
| Line 183: | Line 281: | ||
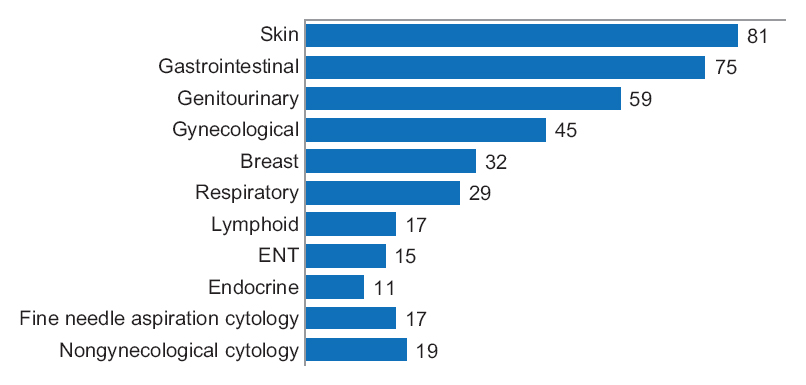
One senior staff pathologist reported 400 consecutive cases in histology, nongynecological, and fine needle aspiration cytology (20 sessions, 20 cases/session), over 4 weeks. Complex, difficult, and rare cases were excluded from the study to reduce the bias. A primary diagnosis was digital, followed by traditional microscopy, six months later, with only request forms available for both. Microscopic slides were scanned at ×20, digital images accessed through the fully integrated [[laboratory information management system]] (LIMS) and viewed in the image viewer on double 23” displays. ('''[[Journal:Diagnostic time in digital pathology: A comparative study on 400 cases|Full article...]]''')<br /> | One senior staff pathologist reported 400 consecutive cases in histology, nongynecological, and fine needle aspiration cytology (20 sessions, 20 cases/session), over 4 weeks. Complex, difficult, and rare cases were excluded from the study to reduce the bias. A primary diagnosis was digital, followed by traditional microscopy, six months later, with only request forms available for both. Microscopic slides were scanned at ×20, digital images accessed through the fully integrated [[laboratory information management system]] (LIMS) and viewed in the image viewer on double 23” displays. ('''[[Journal:Diagnostic time in digital pathology: A comparative study on 400 cases|Full article...]]''')<br /> | ||
</div> | </div> | ||
|- | |- | ||
| Line 358: | Line 448: | ||
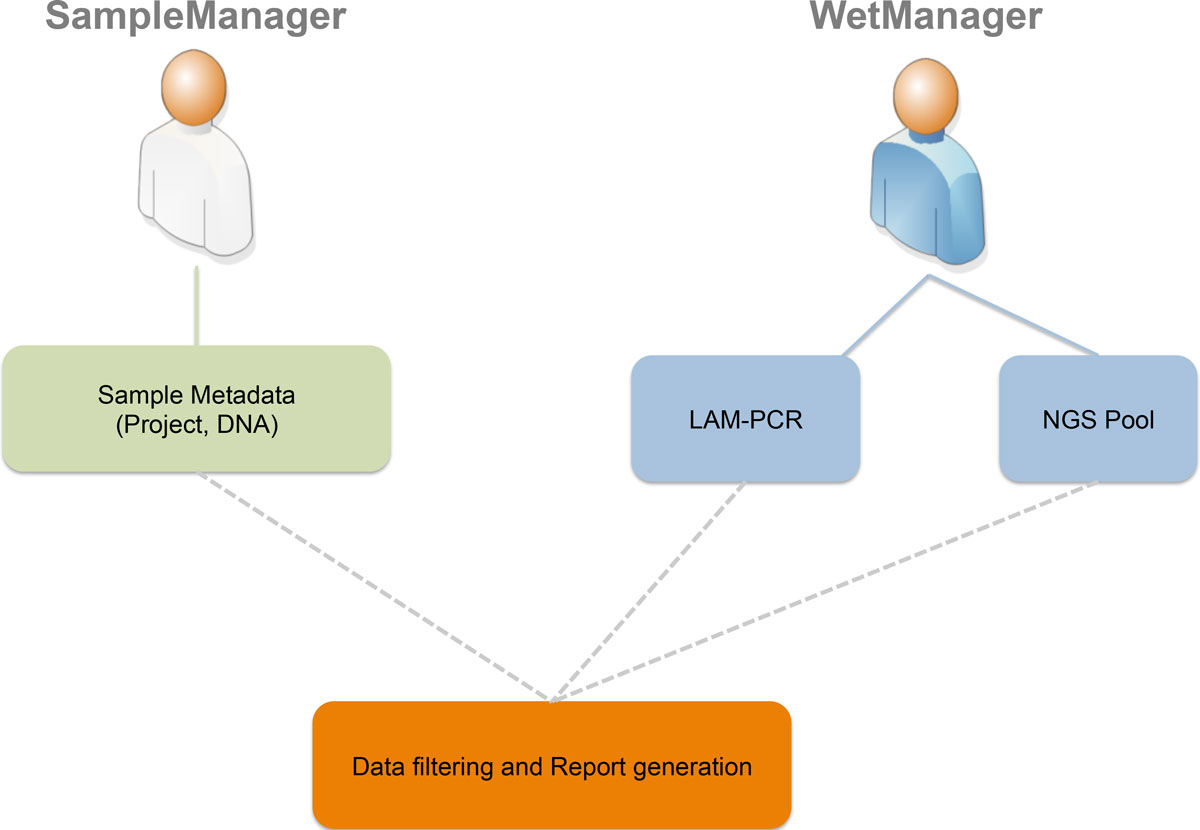
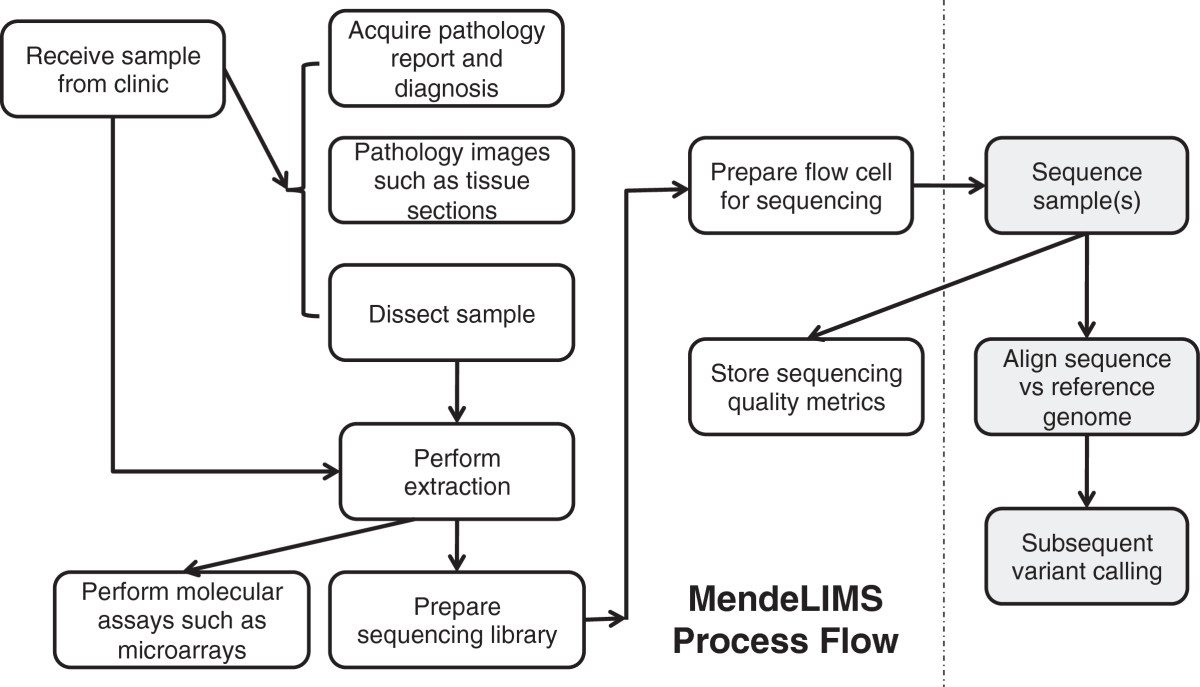
Large clinical genomics studies using next generation DNA sequencing require the ability to select and track samples from a large population of patients through many experimental steps. With the number of clinical genome sequencing studies increasing, it is critical to maintain adequate [[laboratory information management system]]s to manage the thousands of patient samples that are subject to this type of genetic analysis. | Large clinical genomics studies using next generation DNA sequencing require the ability to select and track samples from a large population of patients through many experimental steps. With the number of clinical genome sequencing studies increasing, it is critical to maintain adequate [[laboratory information management system]]s to manage the thousands of patient samples that are subject to this type of genetic analysis. | ||
To meet the needs of clinical population studies using genome sequencing, we developed a web-based laboratory information management system (LIMS) with a flexible configuration that is adaptable to continuously evolving experimental protocols of next generation DNA sequencing technologies. Our system is referred to as [[Stanford University School of Medicine#MendeLIMS|MendeLIMS]], is easily implemented with open source tools and is also highly configurable and extensible. MendeLIMS has been invaluable in the management of our clinical genome sequencing studies. ('''[[Journal:MendeLIMS: A web-based laboratory information management system for clinical genome sequencing|Full article...]]''')<br /> | To meet the needs of clinical population studies using genome sequencing, we developed a web-based laboratory information management system (LIMS) with a flexible configuration that is adaptable to continuously evolving experimental protocols of next generation DNA sequencing technologies. Our system is referred to as [[Vendor:Stanford University School of Medicine#MendeLIMS|MendeLIMS]], is easily implemented with open source tools and is also highly configurable and extensible. MendeLIMS has been invaluable in the management of our clinical genome sequencing studies. ('''[[Journal:MendeLIMS: A web-based laboratory information management system for clinical genome sequencing|Full article...]]''')<br /> | ||
</div> | </div> | ||
|- | |- | ||
Latest revision as of 22:16, 4 April 2024
|
|
If you're looking for other "Article of the Week" archives: 2014 - 2015 - 2016 - 2017 - 2018 - 2019 - 2020 - 2021 - 2022 - 2023 - 2024 |
Featured article of the week archive - 2016
Welcome to the LIMSwiki 2016 archive for the Featured Article of the Week.
Featured article of the week: December 19–25:"Health literacy and health information technology adoption: The potential for a new digital divide" Approximately one-half of American adults exhibit low health literacy and thus struggle to find and use health information. Low health literacy is associated with negative outcomes, including overall poorer health. Health information technology (HIT) makes health information available directly to patients through electronic tools including patient portals, wearable technology, and mobile apps. The direct availability of this information to patients, however, may be complicated by misunderstanding of HIT privacy and information sharing. The purpose of this study was to determine whether health literacy is associated with patients’ use of four types of HIT tools: fitness and nutrition apps, activity trackers, and patient portals. (Full article...)
|
