File:Fig6 Deagen SciData22 9.png
Original file (1,892 × 1,242 pixels, file size: 686 KB, MIME type: image/png)
Summary
| Description |
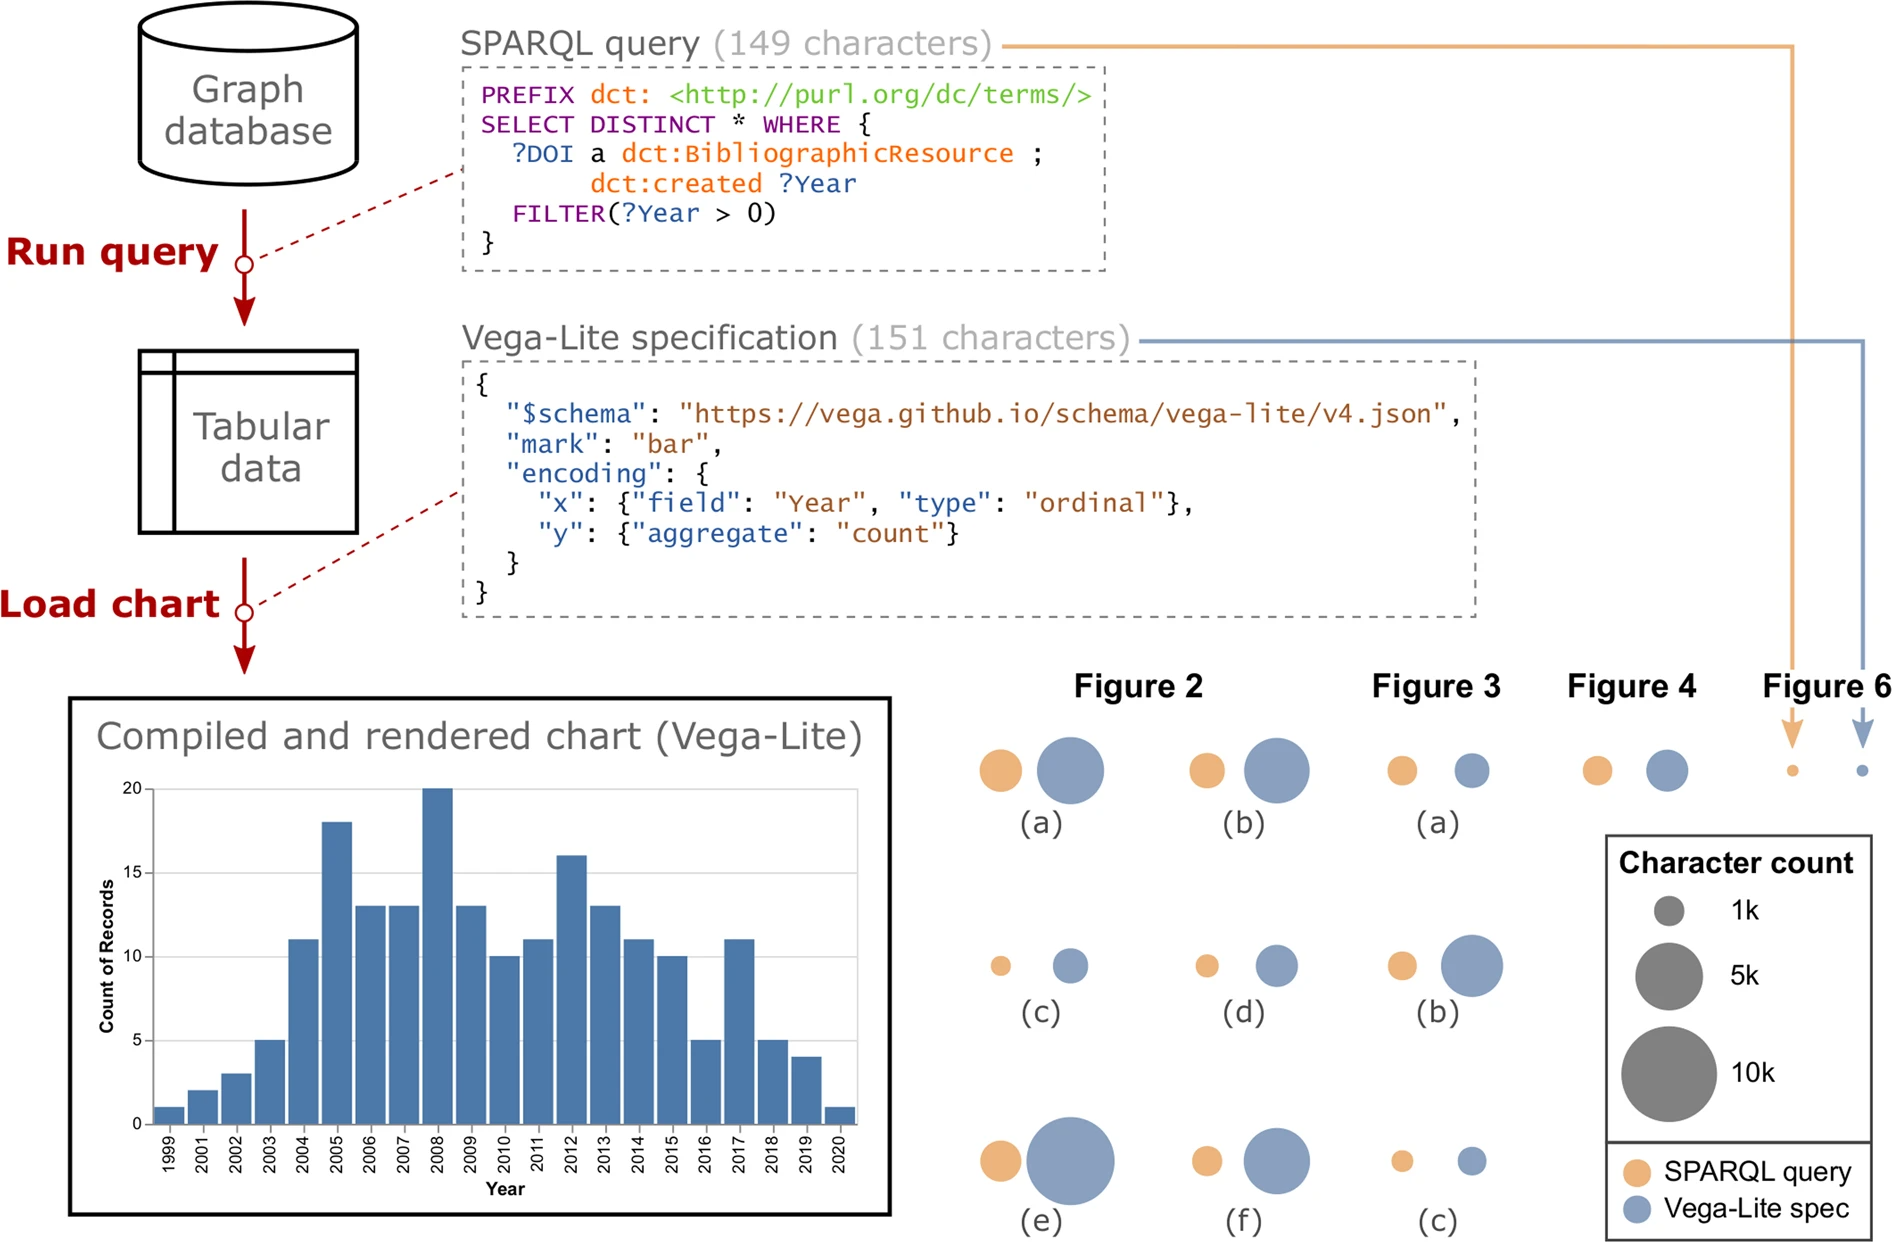
Figure 6. Minimal example of a chart specification. The bar chart in the lower left, showing the counts of curated research articles grouped by year of publication, was generated from a query and chart specification each containing approximately 150 characters. The faceted plot in the lower right, also generated using SPARQL and Vega-Lite, encodes character counts as the size of point marks to compare the relative brevity of this minimal example query and chart specification to other interactive, layered, and stylized charts featured in this article. |
|---|---|
| Source |
Deagen, Michael E.; McCusker, Jamie P.; Fateye, Tolulomo; Stouffer, Samuel; Brinson, L. Cate; McGuinness, Deborah L.; Schadler, Linda S. (2022). "FAIR and interactive data graphics from a scientific knowledge graph". Scientific Data 9: 239. doi:10.1038/s41597-022-01352-z. |
| Date |
2022 |
| Author |
Deagen, Michael E.; McCusker, Jamie P.; Fateye, Tolulomo; Stouffer, Samuel; Brinson, L. Cate; McGuinness, Deborah L.; Schadler, Linda S. |
| Permission (Reusing this file) |
|
| Other versions |
Licensing
|
|
This work is licensed under the Creative Commons Attribution 4.0 License. |
File history
Click on a date/time to view the file as it appeared at that time.
| Date/Time | Thumbnail | Dimensions | User | Comment | |
|---|---|---|---|---|---|
| current | 23:26, 15 June 2024 | | 1,892 × 1,242 (686 KB) | Shawndouglas (talk | contribs) |
You cannot overwrite this file.
File usage
The following page uses this file:


