Difference between revisions of "File:Fig3 Deagen SciData22 9.png"
Shawndouglas (talk | contribs) |
Shawndouglas (talk | contribs) (Added summary.) |
||
| Line 1: | Line 1: | ||
==Summary== | |||
{{Information | |||
|Description='''Figure 3.''' Direct linking to representations of resources in the knowledge graph. These charts make use of dereferenceable URIs in the knowledge graph to display or link to resources. '''a)''' Image marks with accompanying URL encoding channels are used to display curated sample images from Natarajan ''et al.'' (2013) corresponding to the selected points on the adjacent scatter plot. '''b)''' Text marks with a hyperlink encoding channel link open the URL of a journal article DOI when selected. '''c)''' A scatter plot displays charts published to the knowledge graph, arranged by the character length of their Vega-Lite specification and description. Point marks with the hyperlink encoding channel link to a chart page when selected. This final chart is self-referential; the highlighted point mark represents the chart itself. | |||
|Source={{cite journal |title=FAIR and interactive data graphics from a scientific knowledge graph |journal=Scientific Data |author=Deagen, Michael E.; McCusker, Jamie P.; Fateye, Tolulomo; Stouffer, Samuel; Brinson, L. Cate; McGuinness, Deborah L.; Schadler, Linda S. |volume=9 |at=239 |year=2022 |doi=10.1038/s41597-022-01352-z}} | |||
|Author=Deagen, Michael E.; McCusker, Jamie P.; Fateye, Tolulomo; Stouffer, Samuel; Brinson, L. Cate; McGuinness, Deborah L.; Schadler, Linda S. | |||
|Date=2022 | |||
|Permission=[http://creativecommons.org/licenses/by/4.0/ Creative Commons Attribution 4.0 International] | |||
}} | |||
== Licensing == | == Licensing == | ||
{{cc-by-4.0}} | {{cc-by-4.0}} | ||
Latest revision as of 23:03, 15 June 2024
Summary
| Description |
Figure 3. Direct linking to representations of resources in the knowledge graph. These charts make use of dereferenceable URIs in the knowledge graph to display or link to resources. a) Image marks with accompanying URL encoding channels are used to display curated sample images from Natarajan et al. (2013) corresponding to the selected points on the adjacent scatter plot. b) Text marks with a hyperlink encoding channel link open the URL of a journal article DOI when selected. c) A scatter plot displays charts published to the knowledge graph, arranged by the character length of their Vega-Lite specification and description. Point marks with the hyperlink encoding channel link to a chart page when selected. This final chart is self-referential; the highlighted point mark represents the chart itself. |
|---|---|
| Source |
Deagen, Michael E.; McCusker, Jamie P.; Fateye, Tolulomo; Stouffer, Samuel; Brinson, L. Cate; McGuinness, Deborah L.; Schadler, Linda S. (2022). "FAIR and interactive data graphics from a scientific knowledge graph". Scientific Data 9: 239. doi:10.1038/s41597-022-01352-z. |
| Date |
2022 |
| Author |
Deagen, Michael E.; McCusker, Jamie P.; Fateye, Tolulomo; Stouffer, Samuel; Brinson, L. Cate; McGuinness, Deborah L.; Schadler, Linda S. |
| Permission (Reusing this file) |
|
| Other versions |
Licensing
|
|
This work is licensed under the Creative Commons Attribution 4.0 License. |
File history
Click on a date/time to view the file as it appeared at that time.
| Date/Time | Thumbnail | Dimensions | User | Comment | |
|---|---|---|---|---|---|
| current | 23:01, 15 June 2024 | 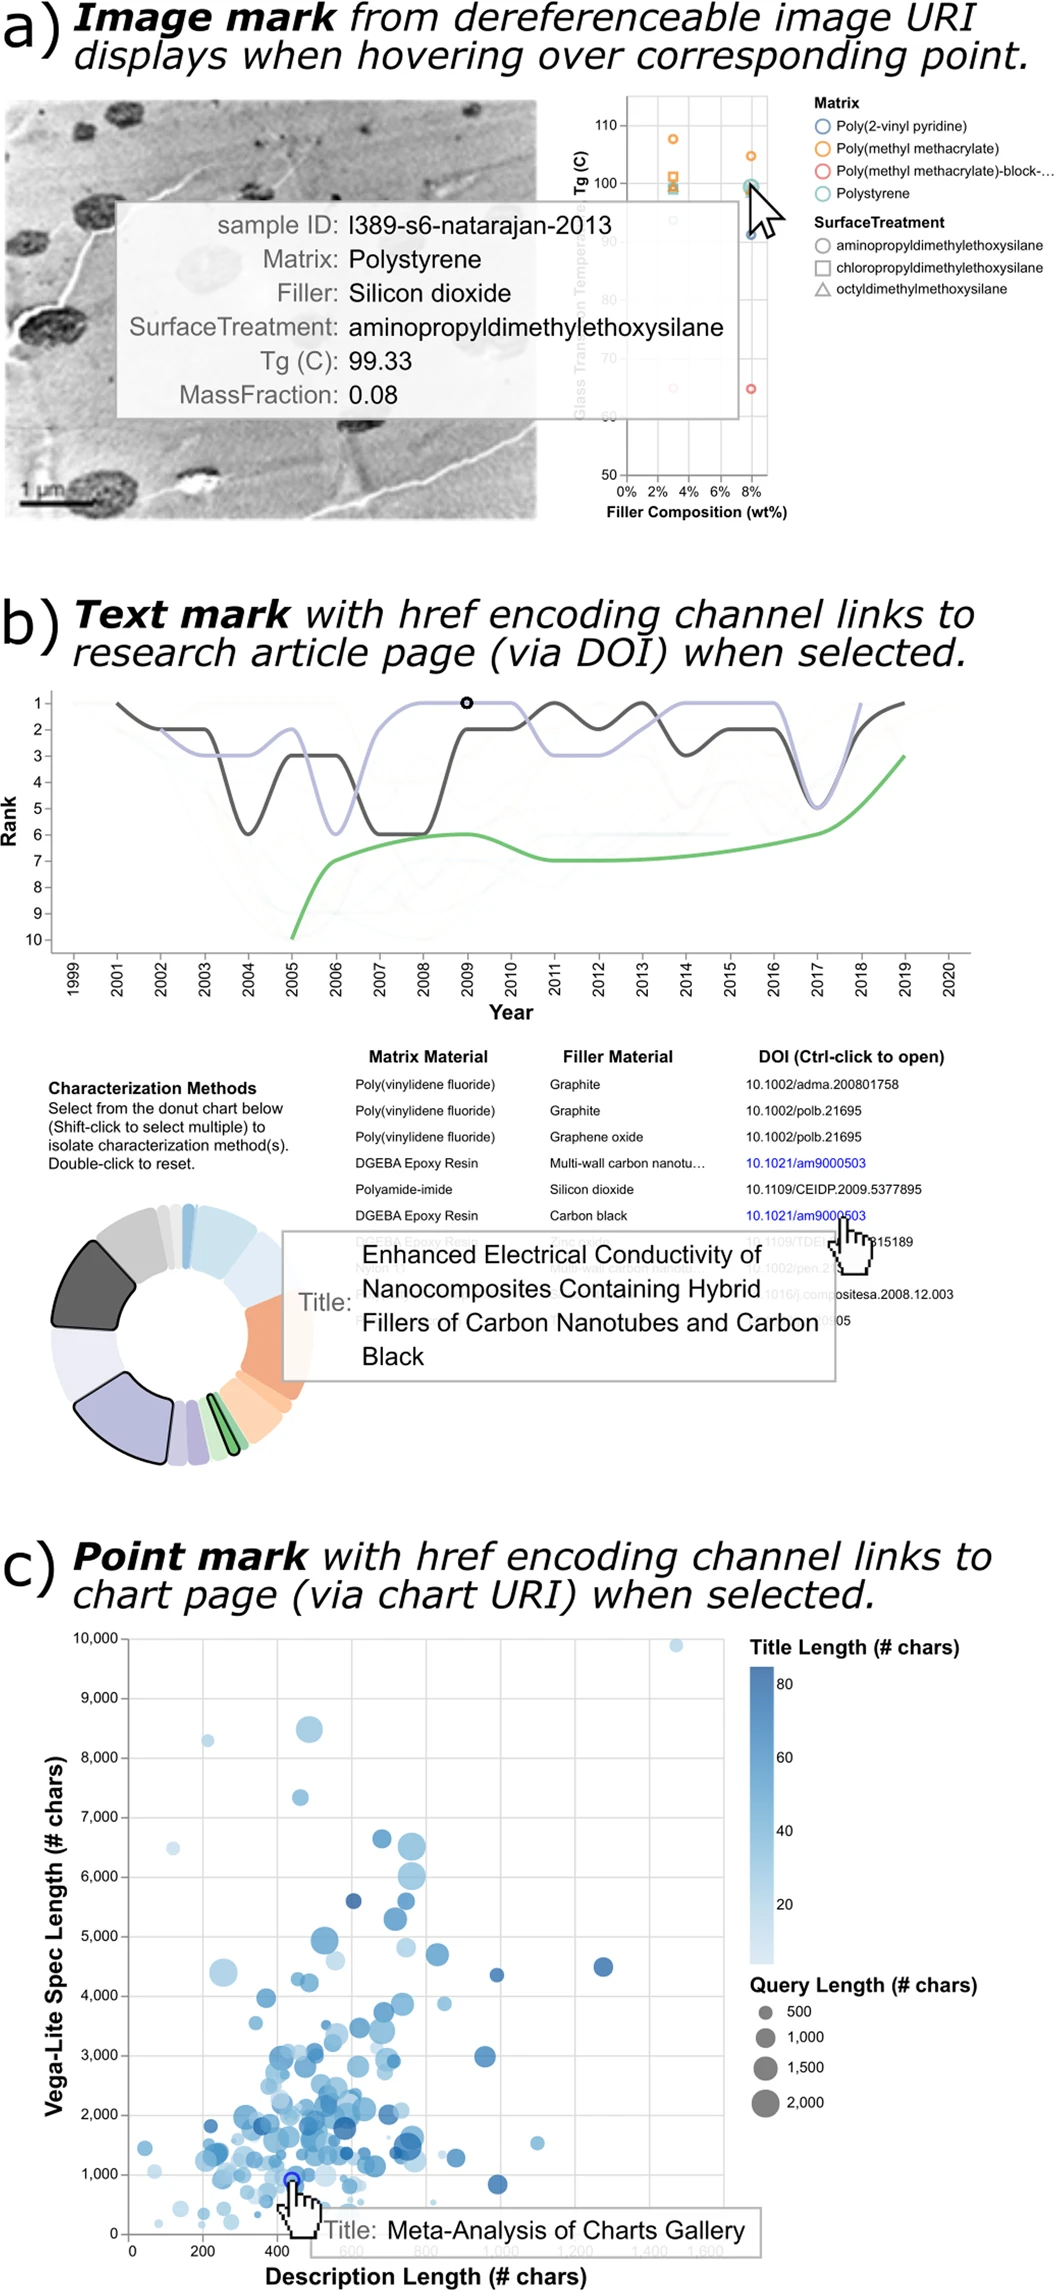 | 1,054 × 2,291 (1,017 KB) | Shawndouglas (talk | contribs) |
You cannot overwrite this file.
File usage
The following page uses this file:


