Difference between revisions of "File:Fig1 Deagen SciData22 9.png"
Shawndouglas (talk | contribs) |
Shawndouglas (talk | contribs) (Added summary.) |
||
| Line 1: | Line 1: | ||
==Summary== | |||
{{Information | |||
|Description='''Figure 1.''' Extending FAIR to data graphics. In the paradigm of charts as metadata, a chart object is modeled as a set of metadata that includes semantic context (SPARQL query) and visual context (Vega-Lite chart specification). With the SPARQL query language and the Vega-Lite grammar of interactive graphics, one can specify interactive charts (e.g., bar charts, scatter plots, heat maps, etc.) that remain synchronized to the content of the knowledge graph and whose data marks can link to dereferenceable URIs (e.g., DOIs, images, other charts, etc.) through hyperlink encoding channels. Combined, these tools offer a human- and machine-interpretable way to explore and share scientific data. | |||
|Source={{cite journal |title=FAIR and interactive data graphics from a scientific knowledge graph |journal=Scientific Data |author=Deagen, Michael E.; McCusker, Jamie P.; Fateye, Tolulomo; Stouffer, Samuel; Brinson, L. Cate; McGuinness, Deborah L.; Schadler, Linda S. |volume=9 |at=239 |year=2022 |doi=10.1038/s41597-022-01352-z}} | |||
|Author=Deagen, Michael E.; McCusker, Jamie P.; Fateye, Tolulomo; Stouffer, Samuel; Brinson, L. Cate; McGuinness, Deborah L.; Schadler, Linda S. | |||
|Date=2022 | |||
|Permission=[http://creativecommons.org/licenses/by/4.0/ Creative Commons Attribution 4.0 International] | |||
}} | |||
== Licensing == | == Licensing == | ||
{{cc-by-4.0}} | {{cc-by-4.0}} | ||
Latest revision as of 22:28, 15 June 2024
Summary
| Description |
Figure 1. Extending FAIR to data graphics. In the paradigm of charts as metadata, a chart object is modeled as a set of metadata that includes semantic context (SPARQL query) and visual context (Vega-Lite chart specification). With the SPARQL query language and the Vega-Lite grammar of interactive graphics, one can specify interactive charts (e.g., bar charts, scatter plots, heat maps, etc.) that remain synchronized to the content of the knowledge graph and whose data marks can link to dereferenceable URIs (e.g., DOIs, images, other charts, etc.) through hyperlink encoding channels. Combined, these tools offer a human- and machine-interpretable way to explore and share scientific data. |
|---|---|
| Source |
Deagen, Michael E.; McCusker, Jamie P.; Fateye, Tolulomo; Stouffer, Samuel; Brinson, L. Cate; McGuinness, Deborah L.; Schadler, Linda S. (2022). "FAIR and interactive data graphics from a scientific knowledge graph". Scientific Data 9: 239. doi:10.1038/s41597-022-01352-z. |
| Date |
2022 |
| Author |
Deagen, Michael E.; McCusker, Jamie P.; Fateye, Tolulomo; Stouffer, Samuel; Brinson, L. Cate; McGuinness, Deborah L.; Schadler, Linda S. |
| Permission (Reusing this file) |
|
| Other versions |
Licensing
|
|
This work is licensed under the Creative Commons Attribution 4.0 License. |
File history
Click on a date/time to view the file as it appeared at that time.
| Date/Time | Thumbnail | Dimensions | User | Comment | |
|---|---|---|---|---|---|
| current | 22:26, 15 June 2024 | 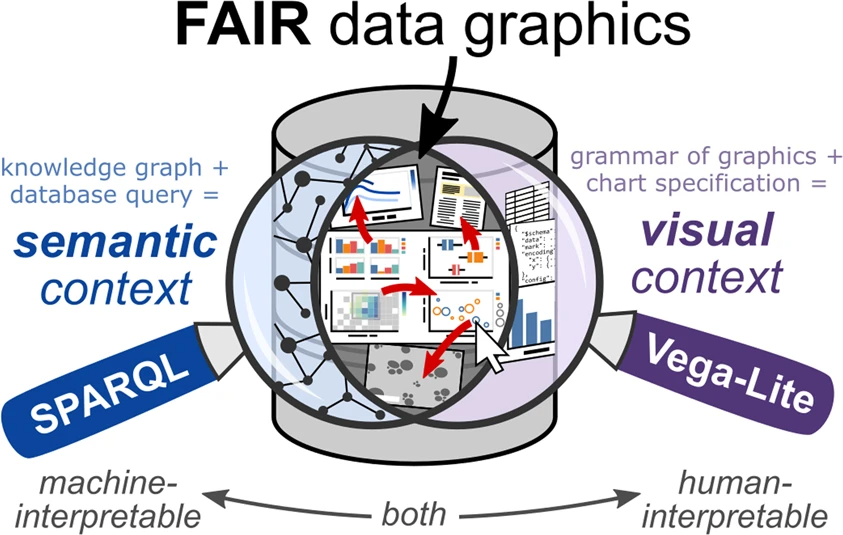 | 843 × 535 (378 KB) | Shawndouglas (talk | contribs) |
You cannot overwrite this file.
File usage
The following page uses this file:


