Difference between revisions of "File:Fig2 Deagen SciData22 9.png"
Shawndouglas (talk | contribs) |
Shawndouglas (talk | contribs) (Added summary.) |
||
| Line 1: | Line 1: | ||
==Summary== | |||
{{Information | |||
|Description='''Figure 2.''' Interactive views of sample data, meta-analyses, and stylized infographics. Charts shown here are specified by a SPARQL query (semantic context) as well as Vega-Lite specification (visual context). The snapshots of interactive data graphics shown here display '''a)''' mechanical tensile testing data curated from Bandyopadhyay ''et al.'' (2005), transformed into a layered composite view; '''b)''' a Weibull plot of dielectric testing data using custom y-axis scaling and the regression transform to estimate dielectric breakdown strength (DBS); '''c)''' a meta-analysis of nanocomposite filler materials in curated research articles per year of publication, highlighted to show the trend for graphene; '''d''' a meta-analysis of entity-resolved compound names (computed by the ChemProps API) versus curator-provided strings; '''e)''' an infographic showing a dataset with increasingly interactive views; and '''f)''' an explanatory graphic for viscoelastic data. These examples created for the materials science domain represent a small subset of the variety of datasets and visualizations made possible by using SPARQL queries and Vega-Lite specifications to capture interactive views of content from a knowledge graph database. | |||
|Source={{cite journal |title=FAIR and interactive data graphics from a scientific knowledge graph |journal=Scientific Data |author=Deagen, Michael E.; McCusker, Jamie P.; Fateye, Tolulomo; Stouffer, Samuel; Brinson, L. Cate; McGuinness, Deborah L.; Schadler, Linda S. |volume=9 |at=239 |year=2022 |doi=10.1038/s41597-022-01352-z}} | |||
|Author=Deagen, Michael E.; McCusker, Jamie P.; Fateye, Tolulomo; Stouffer, Samuel; Brinson, L. Cate; McGuinness, Deborah L.; Schadler, Linda S. | |||
|Date=2022 | |||
|Permission=[http://creativecommons.org/licenses/by/4.0/ Creative Commons Attribution 4.0 International] | |||
}} | |||
== Licensing == | == Licensing == | ||
{{cc-by-4.0}} | {{cc-by-4.0}} | ||
Latest revision as of 22:55, 15 June 2024
Summary
| Description |
Figure 2. Interactive views of sample data, meta-analyses, and stylized infographics. Charts shown here are specified by a SPARQL query (semantic context) as well as Vega-Lite specification (visual context). The snapshots of interactive data graphics shown here display a) mechanical tensile testing data curated from Bandyopadhyay et al. (2005), transformed into a layered composite view; b) a Weibull plot of dielectric testing data using custom y-axis scaling and the regression transform to estimate dielectric breakdown strength (DBS); c) a meta-analysis of nanocomposite filler materials in curated research articles per year of publication, highlighted to show the trend for graphene; d a meta-analysis of entity-resolved compound names (computed by the ChemProps API) versus curator-provided strings; e) an infographic showing a dataset with increasingly interactive views; and f) an explanatory graphic for viscoelastic data. These examples created for the materials science domain represent a small subset of the variety of datasets and visualizations made possible by using SPARQL queries and Vega-Lite specifications to capture interactive views of content from a knowledge graph database. |
|---|---|
| Source |
Deagen, Michael E.; McCusker, Jamie P.; Fateye, Tolulomo; Stouffer, Samuel; Brinson, L. Cate; McGuinness, Deborah L.; Schadler, Linda S. (2022). "FAIR and interactive data graphics from a scientific knowledge graph". Scientific Data 9: 239. doi:10.1038/s41597-022-01352-z. |
| Date |
2022 |
| Author |
Deagen, Michael E.; McCusker, Jamie P.; Fateye, Tolulomo; Stouffer, Samuel; Brinson, L. Cate; McGuinness, Deborah L.; Schadler, Linda S. |
| Permission (Reusing this file) |
|
| Other versions |
Licensing
|
|
This work is licensed under the Creative Commons Attribution 4.0 License. |
File history
Click on a date/time to view the file as it appeared at that time.
| Date/Time | Thumbnail | Dimensions | User | Comment | |
|---|---|---|---|---|---|
| current | 22:50, 15 June 2024 | 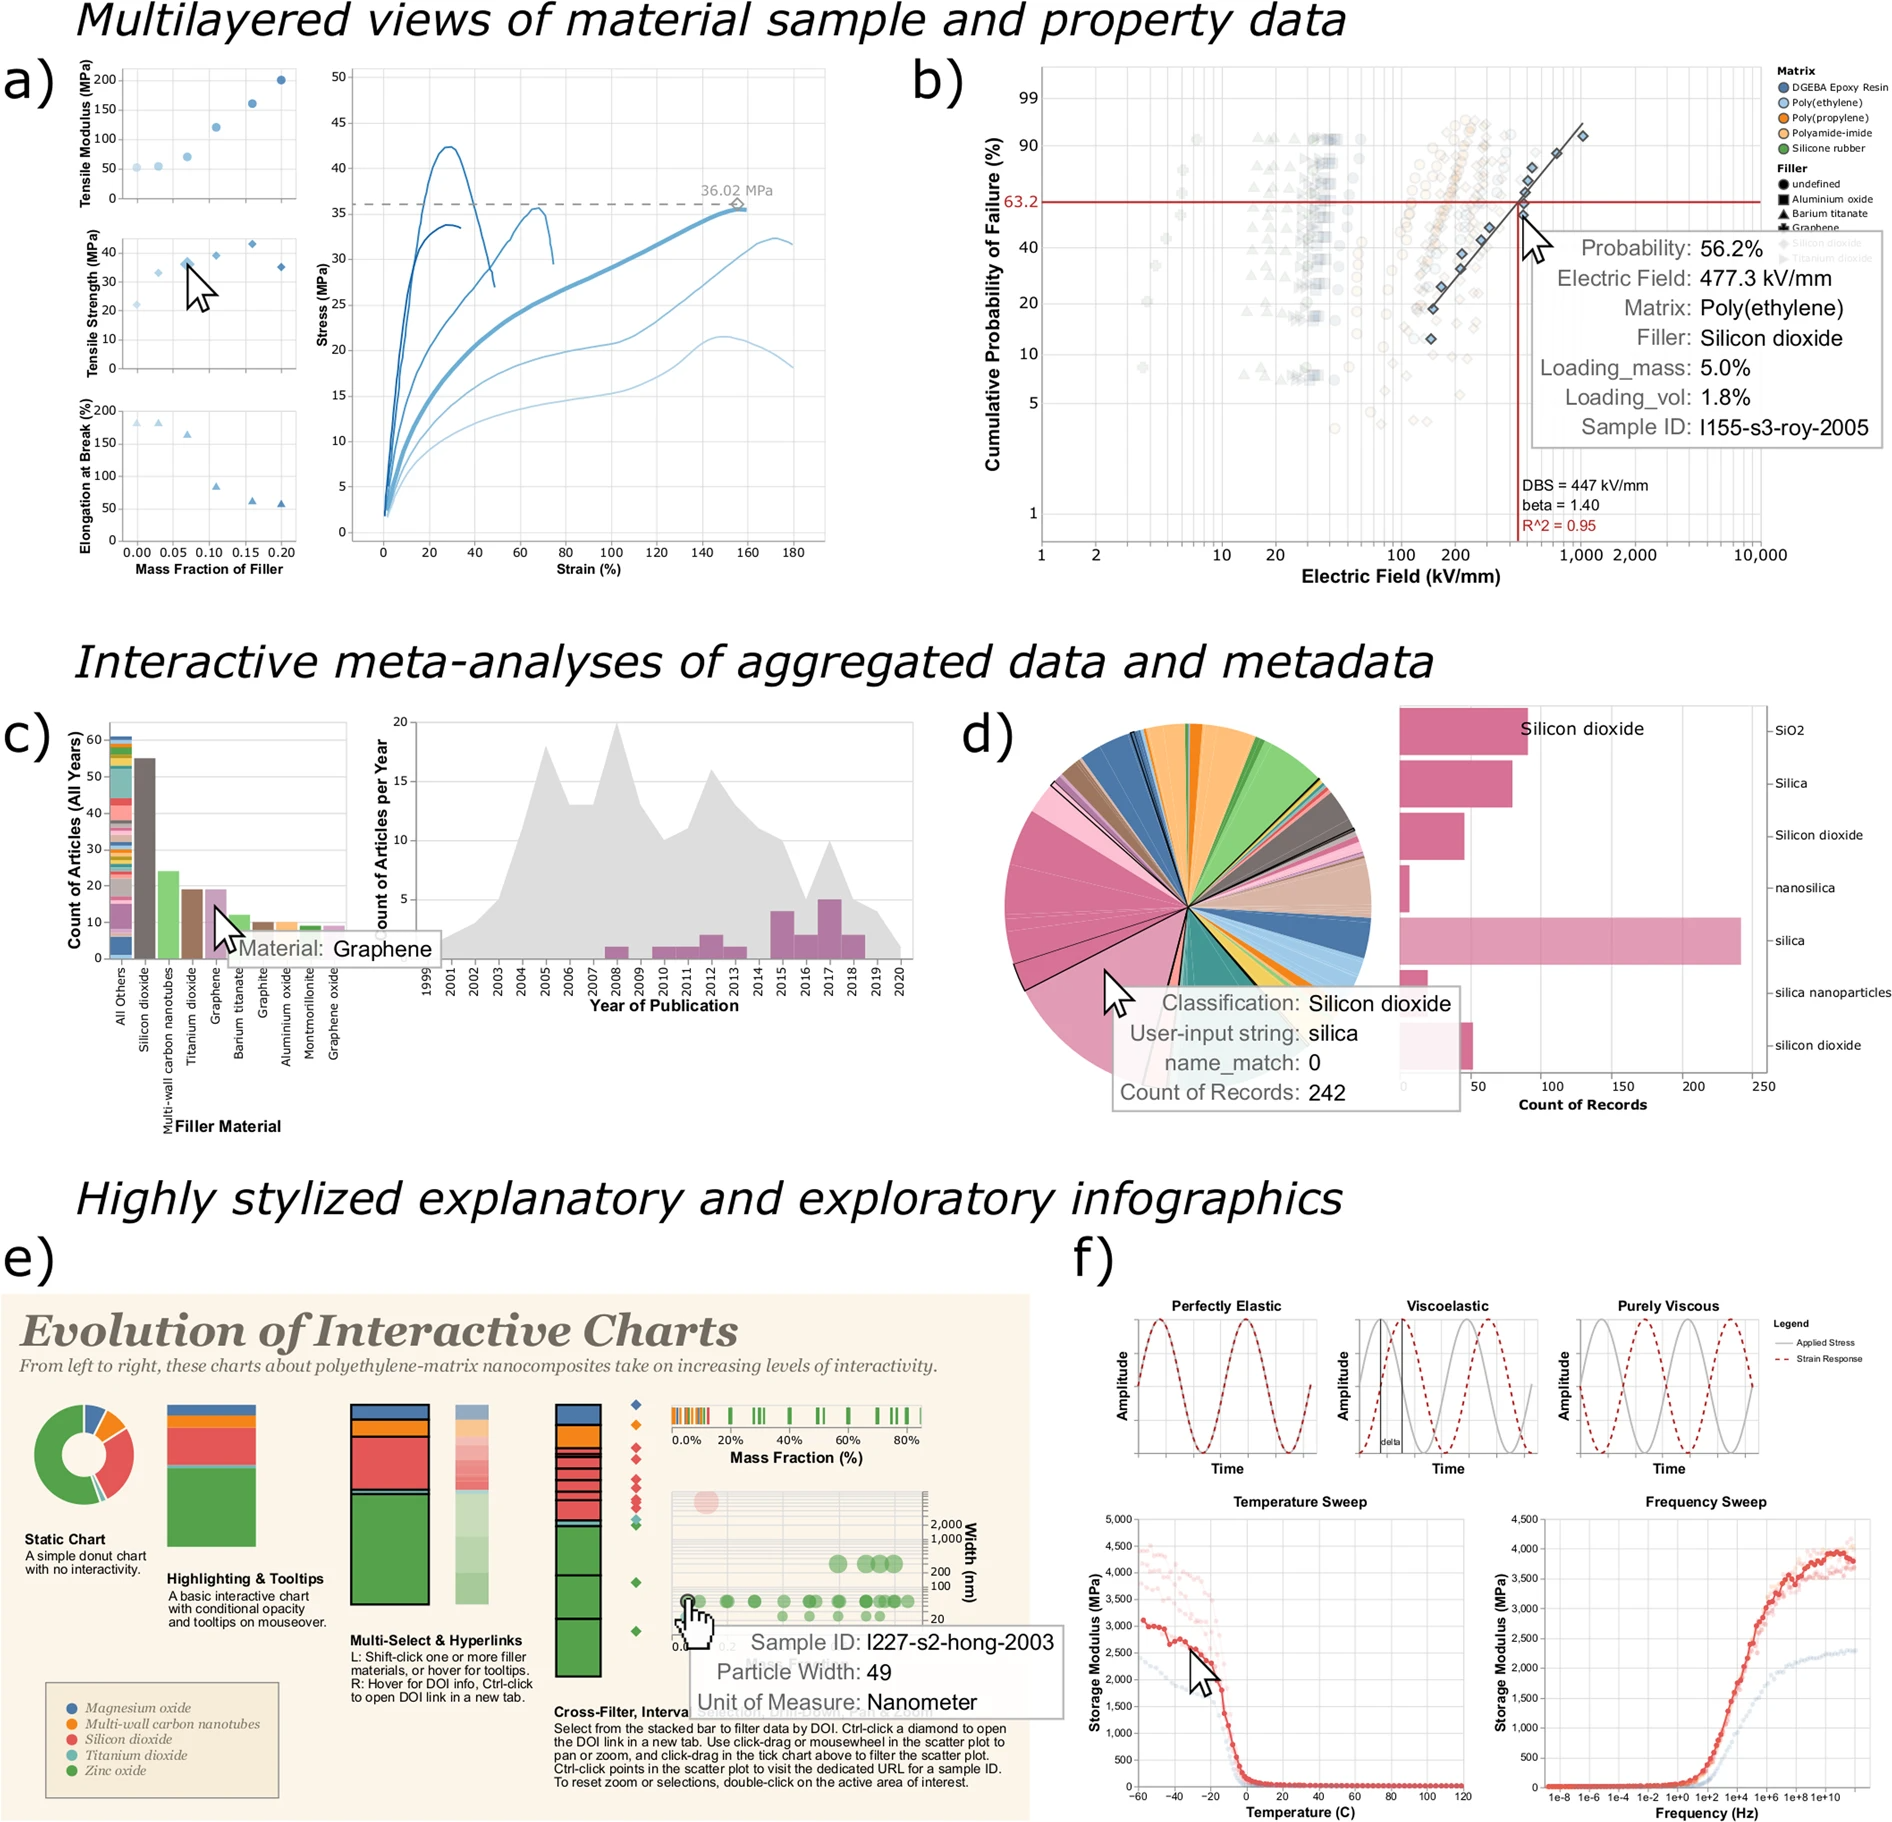 | 1,892 × 1,822 (1.57 MB) | Shawndouglas (talk | contribs) |
You cannot overwrite this file.
File usage
The following page uses this file:


