Journal:Costs of mandatory cannabis testing in California
| Full article title | Costs of mandatory cannabis testing in California |
|---|---|
| Journal | California Agriculture |
| Author(s) | Valdes-Donoso, Pablo; Sumner, Daniel A.; Goldstein, Robin |
| Author affiliation(s) | University of California Agricultural Issues Center, UC Davis |
| Primary contact | Email: pvaldesdonoso at ucdavis dot edu |
| Year published | 2019 |
| Volume and issue | 73(3) |
| Page(s) | 154–60 |
| DOI | 10.3733/ca.2019a0014 |
| ISSN | 0008-0845 |
| Distribution license | Creative Commons Attribution-NonCommercial-NoDerivatives 4.0 International |
| Website | http://calag.ucanr.edu/archive/?article=ca.2019a0014 |
| Download | http://calag.ucanr.edu/archive/?type=pdf&article=ca.2019a0014 (PDF) |
Abstract
Every batch of cannabis sold legally in California must be tested for more than 100 contaminants. These contaminants include 66 pesticides, for 21 of which the state's tolerance is zero. For many other substances, tolerance levels are much lower than those allowed for food products in California. This article reviews the state's testing regulations in context—including maximum allowable tolerance levels—and uses primary data collected from California's major cannabis testing laboratories and several cannabis testing equipment manufacturers, as well as a variety of expert opinions, to estimate the cost per pound of testing under the state's framework. We also estimate the cost of collecting samples, which depends on the distance between cannabis distributors and laboratories. We find that, if a batch fails mandatory tests, the value of cannabis that must be destroyed accounts for a large share of total testing costs, more than the cost of the tests that laboratories perform. Findings from this article will help readers understand the effects of California's testing regime on the price of legal cannabis in the state, and understand how testing may add value to products that have passed a series of tests that aim to validate their safety.
Keywords: cannabis, contaminants, testing
Introduction
Since California's Compassionate Use Act of 1996, cannabis has been legally available—under state but not federal law—to those with medical permission. Until 2018, however, no statewide regulations governed the production, manufacturing, and sale of cannabis. Prior to development and enforcement of statewide regulations, there were no testing requirements for chemicals used during cannabis cultivation and processing, including pesticides, fertilizers, or solvents.[1][2] Residues were common in the legal cannabis supply; a 2017 investigation found that 93% of 44 samples collected from 15 cannabis retailers in California contained pesticide residues.[3] Some studies of data from the unregulated period suggest a relationship between cannabis consumption and exposure to heavy metals[4][5], while others demonstrate that potentially harmful microorganisms may colonize the flowers of the Cannabis plant.[6][7][8][9] A 2017 study raised concerns that in immunocompromised patients, use of cannabis contaminated with pathogens may directly affect the respiratory system, especially when cannabis products are inhaled.[10]
The currently prevailing statutes governing cannabis testing are contained in California Senate Bill 94, the Medicinal and Adult-Use Cannabis Regulation and Safety Act (MAUCRSA) of 2017, which brought together all of California's previous cannabis legislation, including Proposition 64, the Adult Use of Marijuana Act of 2016 (AUMA). Since MAUCRSA, state agencies have propagated regulations for both medical use and adult use (that is, use for nonmedical purposes). MAUCRSA amends various sections of the California Business and Professions Code, Health and Safety Code, Food and Agricultural Code, Revenue and Taxation Code, and Water Code, introducing a new statewide structure for the governance of the cannabis industry, as well as a system by which the state may collect licensing and enforcement fees and penalties from cannabis businesses. A significant portion of MAUCRSA is comprised of testing rules that aim to certify cannabis safety.[11]
These rules, however, may increase the production cost and therefore the retail price of tested cannabis, thereby reducing demand for legal cannabis in California. Thus it is important to understand the costs of cannabis testing relative to the value of generating a safer product. This article evaluates the challenges of safety testing regulations for cannabis in California.
We first review maximum allowable tolerance levels—that is, the amount of contaminants permitted in a sample—under the state's cannabis testing regulations and compare them with tolerance levels for other food and agricultural products produced in California. We then briefly compare testing regimes and rejection rates in other states where medical and recreational use is permitted. Finally, we use primary data from California's major cannabis testing laboratories and from several cannabis testing equipment manufacturers, as well as a variety of expert opinions, to estimate the cost per pound of testing under the state's framework for the cannabis business (taking into account the geographical configuration of the industry). We conclude by discussing implications of this research and potential regulatory changes.
Tests for contaminates and potency
Since July 1, 2018, all cannabis products have been required to pass several tests before they can be sold legally in California. The specific test for each batch of cannabis depends on product type. Types include (a) dried flowers (sometimes in “pre-rolled,” consumer-ready form); (b) edibles (for example cookies, gummy bears, and beverages); (c) vape-pen cartridges containing cannabis oil; and (d) a wide variety of other processed cannabis goods, including tinctures, topicals (such as lotions, lip balms, and creams), and cannabis in crystallized, wax, or solid hashish form.
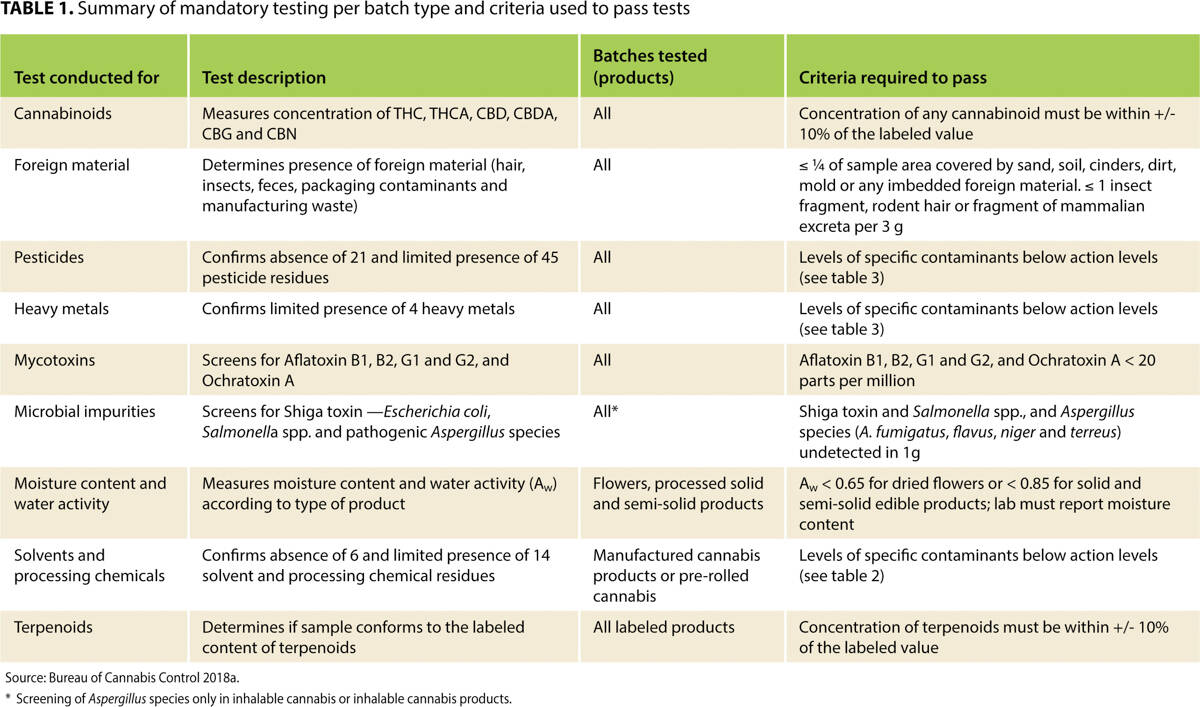
In order to enter the market legally, all these products must be tested for cannabinoids and a large variety of contaminants. Table 1 shows the substances measured in each test (for example, cannabinoids or pesticides), provides a description of each test, and specifies the products to which the test applies and the criteria for passing the test. Most tests—such as those for potency, presence of foreign materials, pesticides, heavy metals, mycotoxins, microbial impurities, and terpenoids—apply to all batches. Moisture tests, however, apply only to flowers and solid or semi-solid products, while tests for solvents or processing chemicals apply only to processed or “manufactured” products. That is, the specifics of each test depend on which cannabis product is tested.
|
Independent, licensed testing laboratories are responsible for receiving samples for testing from licensed distributors. The laboratories then conduct a full set of analyses, following the criteria established by MAUCRSA and specified by regulations. Laboratories must deliver to distributors a certificate of analysis indicating the results (pass or fail) of each analytical test. A batch must pass all required tests before it can be released to retailers.
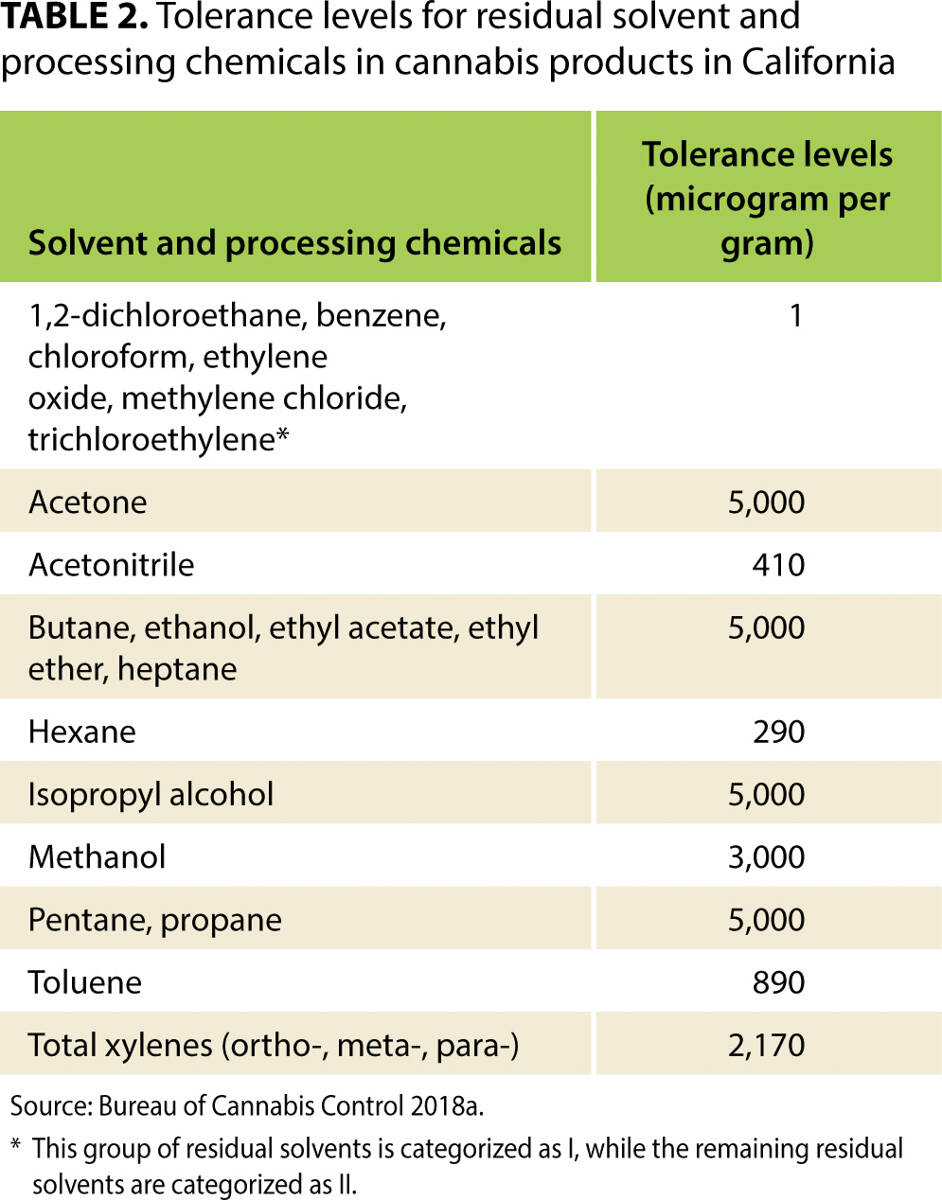
Table 2 shows a list of residual solvents and processing chemicals, with the maximum permitted tolerance (action) levels for legal cannabis. Tests evaluate two groups of solvents and processing chemicals (categories I and II), with a very low tolerance established (1.0 microgram per gram) for those in category I.
|
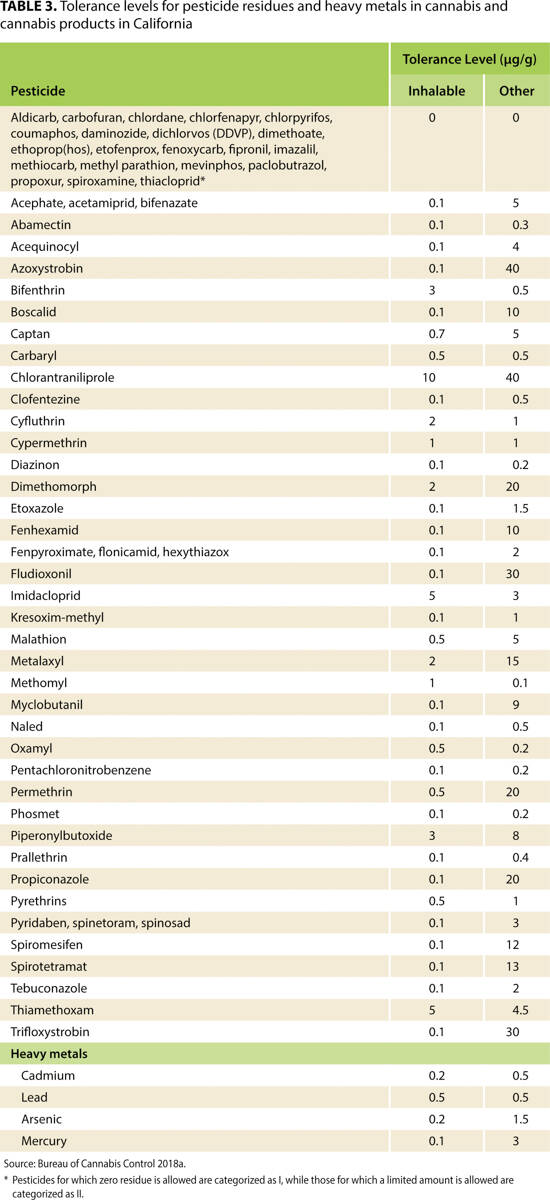
Table 3 shows tolerance levels for pesticide residues and heavy metals. The maximum permitted tolerance levels for pesticide residues are particularly tight when compared with tolerance levels for other agricultural products in California. For many pesticides, the maximum residual level is zero, meaning that very stringent tests are required and that no trace of the chemical may be found. Among pesticides with allowable limits above zero, the tolerance levels for inhalable products are particularly low. In some cases, tolerance levels for inhalable products are one-four-hundredth the levels for other products.
|
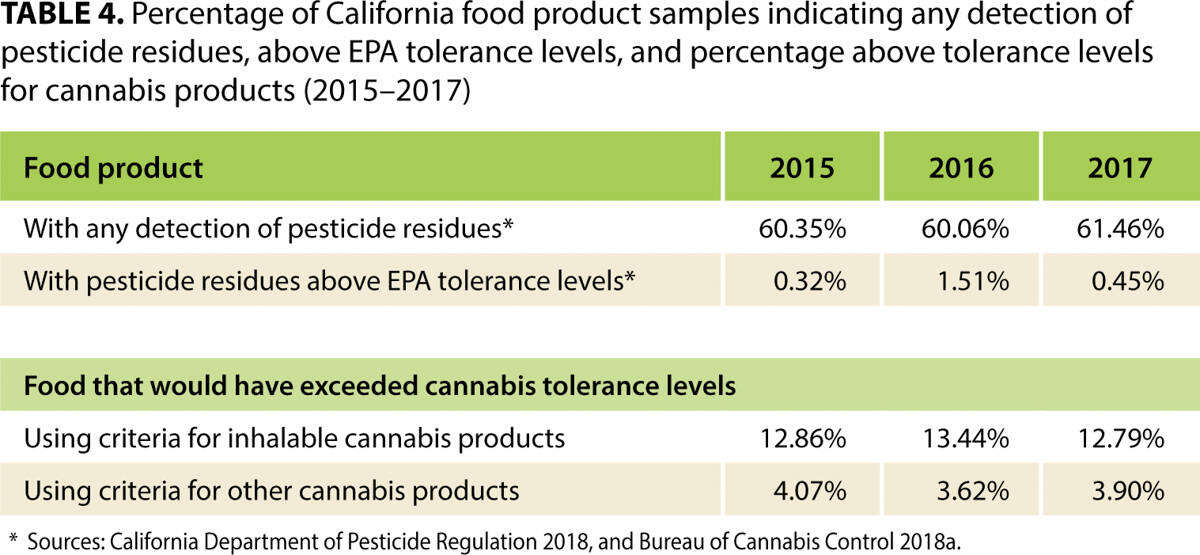
To help interpret the cannabis tolerances, it is helpful to consider them in the context of food safety testing. The top row of Table 4 shows, based on more than 7,000 samples, the percentage of California food products in which, from 2015 to 2017, any pesticide residues were detected.[12] These percentages were above 60%. The second row of Table 4 shows that, despite the high share of food products in which some pesticide residue was detectable, only 1.51% of samples in 2016 contained pesticide residue above tolerance levels set by the U.S. Environmental Protection Agency (EPA), and only 0.45% exceeded those levels in 2017. The bottom panels of Table 4 show that, of the 7,000 samples tested, more than 12% of 2017 samples would have been above California's product tolerance limits for inhalable cannabis. More than 3% of the 2017 samples would have exceeded even the less stringent tolerance levels established for other (non-inhalable) cannabis products. As shown in Table 4, similar results apply to the samples for the other two years.
|
Costs of cannabis testing
In California's licensed, legal cannabis channel, all products must be held by a licensed distributor while they are tested in an independent, licensed laboratory. Licensed testing laboratories do not publish their prices, and the costs of testing services are not generally available. Testing prices depend on the number of samples to be tested, the type of product tested, and the specifics of the contract between the distributor and the laboratory, among other factors.
We collected detailed data to construct in-depth estimates of the capital, fixed, and variable costs required to run a licensed testing laboratory in California. This information included the costs of equipment, facilities, maintenance, supplies, technical and non-technical labor, taxes, and other inputs. We gathered data from established cannabis testing companies (those that have been in business for several years), new cannabis testing companies, laboratories that test other agricultural products, and other industry sources, including advisers of the cannabis industry and cannabis retailers.
We collected prices for testing equipment, supplies, chemical reagents, and other cannabis testing inputs by contacting the sales representatives of large equipment supply companies (Aligent Technologies Inc., Schimadzu Scientific Instruments Inc., and VWR). We considered the costs of sampling and transportation to and from test facilities, adjusting those cost estimates according to the geographical configuration of testing laboratories and distributors across the state.
Finally, we used data from the California Department of Pesticide Regulation (see Table 4) and some assumptions based on experience in other states to estimate the share of cannabis that fails testing and therefore the lost inventory due to failed tests. To make these cost calculations, we accounted for inventory that first fails testing, but then is remediated. In addition, to understand the opportunity cost of cannabis used in the tests or lost in the process, we use data from wholesale prices and a survey of retail cannabis prices conducted by the University of California Agricultural Issues Center (unpublished data from Goldstein et al.).
Based on this information, we developed a cost per unit of cannabis tested for representative labs of three different sizes to approximate the distribution of costs in the industry. For simplicity, we assumed that testing labs of different sizes use the same inputs, but in different proportions, to provide testing services. We assume economies of scale, with higher share of capital costs per unit of output for the smaller labs. We used information reported by the Bureau of Cannabis Control in the first half of 2018 to compile a list of cannabis licensed testing laboratories and distributors in California.[13]
We used information on the geographic location of testing labs relative to cannabis production and consumption to assess the cost of transporting samples from distributors to testing labs. In March 2019, there were 49 active testing licensees and 1,213 licensed distributors. Both testing licensees and distributors are located in many areas across the state, but they are concentrated in traditional cannabis production areas in the North Coast region of California and in large population centers.
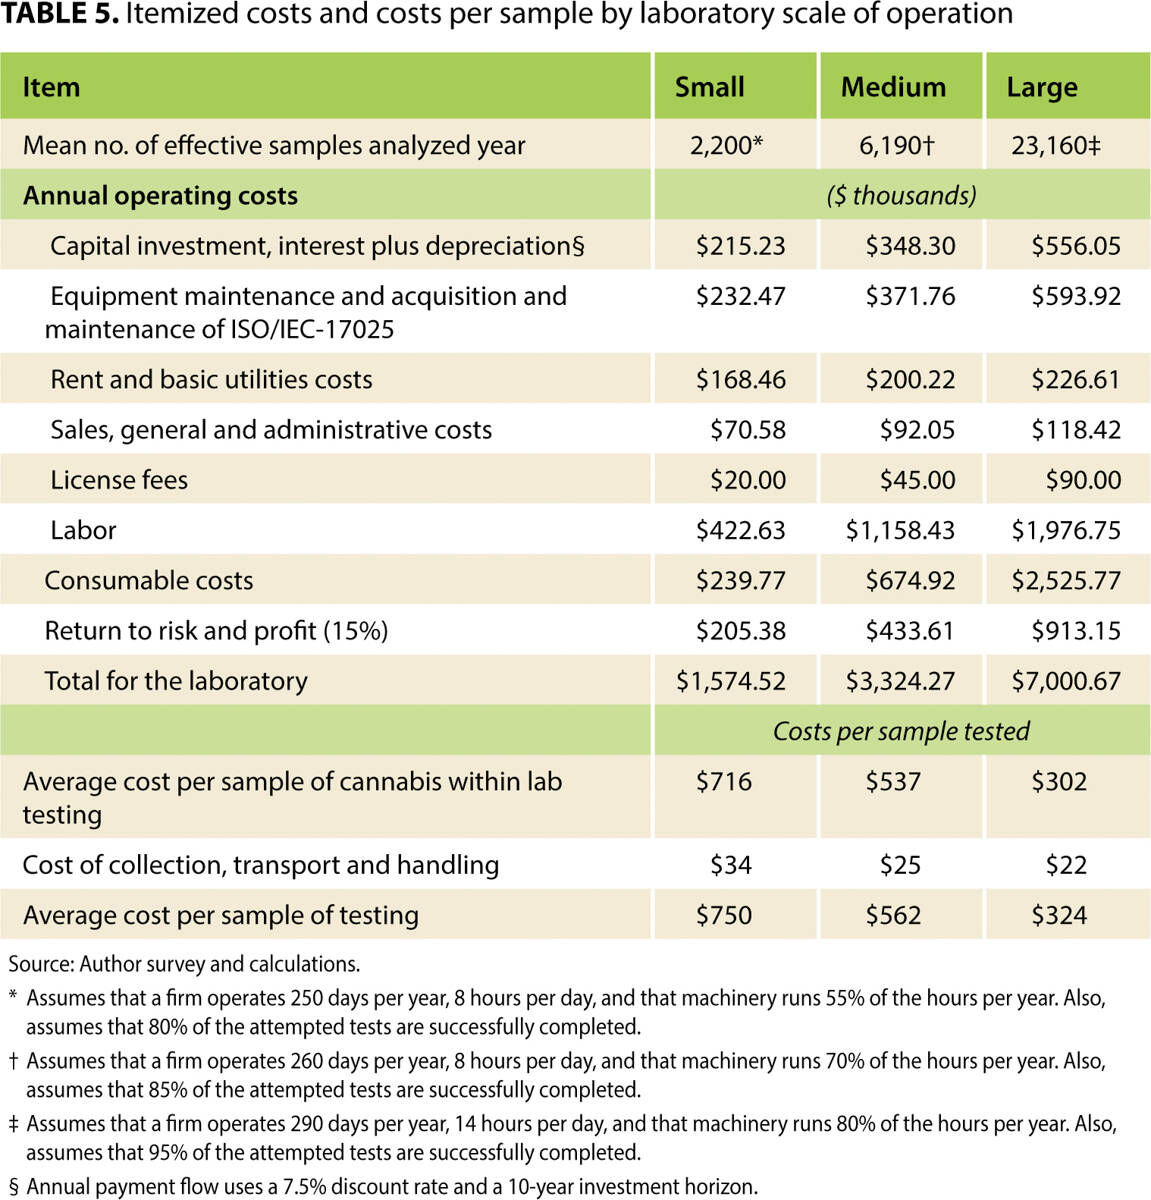
Table 5 shows capacities, annualized capital costs, and other annual expenses for three size categories of testing labs: small, medium, and large. The size categories are based on the number of samples analyzed annually (2,200, 6,190, and 23,160, respectively) and were chosen to represent typical firms, based on our discussions with the industry. We assume about 25% of labs are small, 25% are large and the remaining half are in the medium category. By regulation, these labs test only cannabis. The annualized cost of specific testing equipment and other general laboratory equipment is a significant share of total annual costs. The cost of equipment and installation is about $1.5 million for a small lab, about $2.4 million for a medium lab, and about $3.8 million for a large lab. These costs are expressed as annual flows in table 5.
|
To account for the annual cost of investment in equipment, we use a discount rate of 7.5% per year that reflects the combined effects of depreciation and interest over a 10-year horizon, using the standard equivalent annual cost formula, typically used in budgeting studies:
Annual Cost = (0.075)K/(1 – (1.075)–10),
where K is the invested capital for each of the three testing labor sizes. These annualized costs of the invested capital for each size of testing lab operations are shown in the top row of Table 5.
Our survey and discussions with laboratories provide the rest of the estimated costs. Equipment maintenance costs, rent, utilities, and labor also are large cost categories. Each of these costs is less than proportional to the number of samples tested and thus contributes to economies of scale. This cost of consumable supplies is calculated on a per sample basis and thus is proportional to the number of samples tested. Finally, the return to risk and profit is estimated as 15% of the sum of the foregoing expenditures. Our estimated total annual costs are about $1.6 million for small labs, $3.3 million for medium labs, and $7.0 million for large labs.
The scale advantage of larger testing labs is reflected in the testing cost per sample: $324 for large labs, compared with $562 for medium labs and $750 for small labs. These cost differences arise from economies in scale in the use of laboratory space, equipment, and labor. Each large testing lab processes about 10 times the number of samples as a small lab but has annualized operating costs only about five times those of a typical small testing lab. That means that small-scale labs tend to specialize in servicing more remote cultivators or manufacturers that have products handled by smaller and more remote distributors located at a cost-prohibitive distance from large labs.
We used data on the annual testing capacities of small, medium, and large labs and our assumption about the number labs of each size to calculate the share of testing done by labs of each size category. We expect that small labs will test about 6% of all legal cannabis in the state by volume, medium-sized labs will test about 33% of legal cannabis, and large labs will test 61% of legal cannabis. Using these shares, the weighted average cost per sample tested is about $428.
Let us now turn from the cost per batch tested to the cost per pound of cannabis marketed. The per pound costs of laboratory testing depends on the number of pounds tested in each test. Therefore, we must consider batch size. Regulations have set a maximum batch size of 50 pounds of Cannabis flowers (or 150,000 units for processed cannabis products). We expect that the batch size will differ within this constraint depending on the product type and origin, as well as the size of the cultivator and manufacturer, and as such, we explore implications of batch size differences. Using the weighted average cost per sample of $428, the testing cost for a small batch of five pounds is $85.60, while for the largest-allowed batch size of 50 pounds, the cost is just $8.56 per pound.
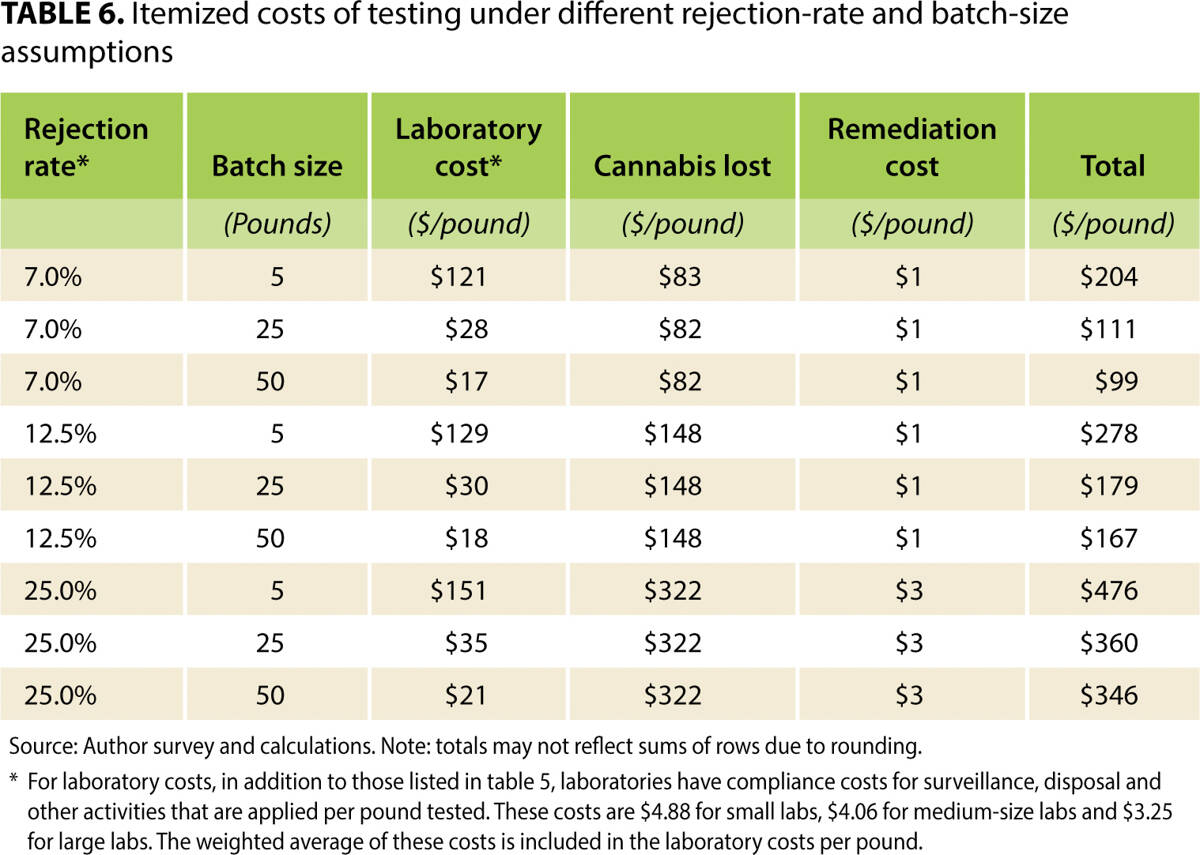
Next, we turn to several costs not included in the cost of testing a sample in the lab (these costs are included in Table 6). First and most straight forward is the cost of compliance with security measures—including video surveillance—as well as archiving, disposing, quarantining, and other compliance costs; we estimated that cost to be equivalent to $4.88 per pound for small labs, $4.06 per pound for medium labs, and $3.25 per pound for large labs, for a weighted average of $3.62 per pound.
|
The cost of testing requirements on a retail cost basis is best expressed as the full cost per unit of cannabis that reaches the market. Expressing the full cost in this way raises two additional costs.
The first is simple: the value of the cannabis used up in the testing procedure. Based on MAUCRSA, the sample size must be at least 0.35% of the total batch of cannabis tested. We use an average wholesale value of $1,360 per pound of Cannabis flower equivalent at the testing stage, which represents a recent weighted average price across outdoor grown, greenhouse grown, and indoor grown Cannabis and products.[14] Thus, for each pound of cannabis tested, flower worth $4.76 is used up.
The second issue, costs associated with a failure to pass the test, is more complex. These costs include the cost of the testing process as well as the (much greater) cost of the cannabis that must be destroyed when it is considered unacceptable to be marketed by virtue of a failed test.
Stringent maximums for pesticides, microbials, and other contamination mean that there will be a significant chance that a sample is rejected. In some cases, the owner will attempt to remediate or process that batch, intending to eliminate the cause of the failed test. A batch can be remediated up to two times. If a batch fails its testing after its second remediation, regulations mandate that that batch must be destroyed in a verifiable way. This is a major cost of the testing regime required by California legislation and regulation.
To estimate the cost of such rejections, we used a range of potential rejection rates, drawing from information that was available on contamination of cannabis in other states. However, the experience of other states is of limited value and must be adjusted based on information from industry sources.
For example, Washington State mandates tests on potency, moisture, foreign matter, microbiological and mycotoxin screening, residual solvents, and heavy metals, but, unlike in California, testing on pesticide residues is not mandatory.[15] Washington State enforcement is based on spot checks. Based on Washington State data, we found that in 2017, the second year after the testing began, 8% of the total samples submitted failed one or more tests.
Colorado state mandates tests on residual solvents, microbial, mycotoxins, heavy metals, pesticides, and potency. The Colorado Marijuana Enforcement Division reported that during the first six months of 2018, 8.9% of total samples of adult-use cannabis failed testing.[16] Testing on pesticide residues only became mandatory in August of 2018 in Colorado, so systematic data on test results were not available. However, the Department of Agriculture in Colorado informed us (personal communication from Michael Rigirozzi, Colorado Department of Agriculture) that 60% of spot-checks based on complaints or concerns between 2015 and 2017 found pesticide residues.
Given the cost of cannabis that must be destroyed in case of failed tests, cultivators and manufacturers may pre-test to decrease the chances of failing official tests. For our cost analysis, we assume that 25% of cannabis is pre-tested before being submitted for the formal and binding tests. To express costs in terms of the pounds of cannabis legally marketed, and account for pre-testing and pounds lost because of testing, we need to express the ratio of pounds tested to pounds that pass testing. The following equation expresses that ratio tested to passed:
Ratio of tested to passed = [1+ pretest% + (fail%) × (retest%)] / [1 – (fail% – (fail%) × (retest%) × (fail% of retests)]
Into this equation we put assumptions for the pretest, fail, and retest rates based on our best assessments after interviewing testing labs and analyzing data from other states. We set the pretest share at 25%, the retest share of failed samples at 50%, and the failure rate of retested samples at 50%. We explore costs associated with three initial failure rates—7%, 12.5%, and 25%—to reflect the range of information we gathered. With these inputs to the equation, the ratio of tested cannabis to passed cannabis is 1.365 if the initial failure rate is 7%, 1.448 if the initial failure rate is 12.5%, and 1.692 if the initial failure rate is 25%. These factors must be multiplied by all the costs per pound tested to calculate the cost per pound of cannabis actually marketed.
Table 6 (previous) reports, in three components, the costs per pound of cannabis marketed: (1) the cost of laboratory testing, (2) the value of lost inventory (opportunity cost of cannabis rejected), and (3) the relatively small cost of remediating failed batches. For small batch sizes, laboratory testing costs are an important testing cost, especially when the rejection rate is low. For a 50-pound batch size, laboratory costs are a small share of overall costs, especially as rejection rates rise. In the medium case of a 25-pound batch and a 12.5% rejection rate, which might be fairly typical, lab costs are $30 per pound and the cost of cannabis lost in the testing process is $148, so laboratory testing represents only one-sixth the total cost of complying with laws and regulations regarding mandatory testing. In this case, the total cost of testing, including the loss of the potential value of marketable cannabis, is $179 per pound, or about 13% of the wholesale value of cannabis assumed in this research.
Legal versus illegal: Implications and regulations
The costs of establishing and operating a cannabis testing facility that meets California's mandates are largely accounted for by investment in precise equipment, the cost of highly skilled labor, and costs of materials. Testing is expensive, but the lost value of cannabis that fails tests to enter the legal retail market is an even bigger issue. It is difficult to predict rejection rates with great confidence; the data we present, however, is consistent with reports of pesticide detection in California food crops and information available from other states. Evidence suggests that major drivers of both direct laboratory costs and lost cannabis costs are low or zero tolerance levels set for pesticides (see Tables 2 and 3) and the difficulty of dealing with microbial contamination. We have shown that if these low tolerance levels were applied to other California food crops, a significant proportion would have failed tests in recent years (see Table 4). Thus California's safety standards for cannabis are tight compared to other states' standards and to standards for other products within California. We note that there may be safety reasons that cannabis is subject to such tight tolerance levels, but they are not in the literature and are beyond the scope of this article.
California's system for testing cannabis has been under pressure since the implementation of the state's testing regime in July 2018 because of difficulties in supplying the market with product that has passed the tests and has been labeled correctly. Some producers, after receiving inconsistent test results for contaminant residues from different laboratories, have voluntarily recalled product.[17][18] However, California has not yet reported detailed data on official test rejection rates.
Costs of testing will be reflected in the price of marketed legal cannabis. Thus it is crucial to understand the value that testing creates for consumers compared to the costs. Competition between legal cannabis and untested illegal cannabis is a major issue in cannabis policy. Rules that help ensure safe and high-quality products for consumers of legal cannabis can encourage some consumers to shift from the illegal supply chain to the legal, licensed supply chain. Before the passage of AUMA in 2016, the low prevalence of testing in California's essentially unregulated market for medicinal cannabis indicated that many consumers entertained a limited willingness to pay for higher safety standards. This suggests that at least some consumers may remain today in the illegal, low-priced market, even though certified, tested products are available in the licensed supply chain.
Taxes and regulations will make legal cannabis more expensive than illegal cannabis. However, safety testing is the basis of product differentiation for legal cannabis sold through licensed retailers. In some agricultural product industries, growers have urged product safety and consistency standards, as well as more stringent testing standards, to increase demand.[19] As the regulated cannabis market develops, we expect that increased access to data will help clarify the impact on demand of mandatory testing rules.
References
- ↑ Lindsey, T.D. (10 April 2012). "Medical Marijuana Cultivation and Policy Gaps" (PDF). California Research Bureau. https://www.canorml.org/prop/CRB_Pesticides_on_Medical_Marijuana_Report.pdf.
- ↑ Stone, D. (2014). "Cannabis, pesticides and conflicting laws: The dilemma for legalized States and implications for public health". Regulatory Toxicology and Pharmacology 69 (3): 284–8. doi:10.1016/j.yrtph.2014.05.015. PMID 24859075.
- ↑ Grover, J.; Glasser, M. (22 February 2017). "Pesticides and Pot: What's California Smoking?". NBC4 Los Angeles. https://www.nbclosangeles.com/news/local/I-Team-Marijuana-Pot-Pesticide-California-414536763.html.
- ↑ Moir, D.; Rickert, W.S.; Levasseur, G. et al. (2008). "A comparison of mainstream and sidestream marijuana and tobacco cigarette smoke produced under two machine smoking conditions". Chemical Research in Toxicology (2): 494–502. doi:10.1021/tx700275p. PMID 18062674.
- ↑ Singani, A.A.S.; Ahmadi, P. (2012). "Manure Application and Cannabis Cultivation Influence on Speciation of Lead and Cadmium by Selective Sequential Extraction". Soil and Sediment Contamination (3): 305–21. doi:10.1080/15320383.2012.664186.
- ↑ McLaren, J.; Swift, W.; Dillon, P. et al. (2008). "Cannabis potency and contamination: A review of the literature". Addiction 103 (7): 1100–9. doi:10.1111/j.1360-0443.2008.02230.x. PMID 18494838.
- ↑ McPartland, J.M. (2002). "Chapter 30: Contaminants and Adulterants in Herbal Cannabis". In Grotenhermen, F.; Russo, E.. Cannabis and Cannabinoids: Pharmacology, Toxicology, and Therapeutic Potential. The Haworth Press. pp. 337–344. ISBN 9780789015082.
- ↑ McPartland, J.M., McKernan, K.J. (2017). "Contaminants of Concern in Cannabis: Microbes, Heavy Metals and Pesticides". In Chandra, S.; Lata, H.; ElSohly, M.. Cannabis sativa L. - Botany and Biotechnology. Springer. pp. 457–74. ISBN 9783319545646.
- ↑ Ruchlemer, R.; Amit-Kohn, M.; Raveh, D. et al. (2015). "Inhaled medicinal cannabis and the immunocompromised patient". Supportive Care in Cancer 23 (3): 819-22. doi:10.1007/s00520-014-2429-3. PMID 25216851.
- ↑ Thompson, G.R. 3rd; Tuscano, J.M.; Dennis, M. et al. (2017). "A microbiome assessment of medical marijuana". Clinical Microbiology and Infection 23 (4): 269-270. doi:10.1016/j.cmi.2016.12.001. PMID 27956269.
- ↑ California Bureau of Cannabis Control (October 2018). "California Code of Regulations, Title 15, Division 42, Bureau of Cannabis Control" (PDF). https://www.bcc.ca.gov/law_regs/cannabis_text.pdf. Retrieved 12 November 2018.
- ↑ California Department of Pesticide Regulation (2018). "Pesticide Residue Monitoring Program". https://www.cdpr.ca.gov/docs/enforce/residue/rsmonmnu.htm. Retrieved 11 November 2018.
- ↑ Bureau of Cannabis Control (2018). "Cannabis License Search". California Cannabis Portal. https://cannabis.ca.gov/check_a_license/. Retrieved 11 November 2018.
- ↑ University of California Agricultural Issues Center (18 April 2018). "Economic Costs and Benefits of Proposed Bureau of Cannabis Control Regulations for the Implementation of the Medicinal and Adult Use Cannabis Regulation and Safety Act (MAUCRSA)" (PDF). http://www.dof.ca.gov/Forecasting/Economics/Major_Regulations/Major_Regulations_Table/documents/DCA_Cannabis_SRIA_2018.pdf.
- ↑ Washington State Legislature (2018). "Chapter 314-55 WAC, Marijuana Licenses, Application Process, Requirements, and Reporting". Washington Administrative Code. https://apps.leg.wa.gov/wac/default.aspx?cite=314-55. Retrieved 15 April 2019.
- ↑ Colorado Department of Revenue (2018). "2018 MED Annual Update". MED Updates. https://www.colorado.gov/pacific/enforcement/med-updates. Retrieved 05 May 2018.
- ↑ Schroyer, J. (19 July 2018). "Profits are a rarity: California’s new regulated marijuana market six months in". Marijuana Business Daily. https://mjbizdaily.com/profits-are-a-rarity-californias-new-regulated-marijuana-market-six-months-in/.
- ↑ Schroyer, J. (31 July 2018). "Second voluntary cannabis product recall issued in California". Marijuana Business Daily. https://mjbizdaily.com/second-voluntary-cannabis-product-recall-issued-in-california/.
- ↑ Gray, R.S.; Sumner, D.A.; Alston, J.M. et al. (March 2005). "Economic Consequences of Mandated Grading and Food Safety Assurance: Ex Ante Analysis of the Federal Marketing Order for California Pistachios" (PDF). Giannini Foundation Monograph 46. University of California Agriculture and Natural Resources. https://s.giannini.ucop.edu/uploads/giannini_public/5f/65/5f651bff-93e6-47a4-b0b2-38757c3a3294/46_pistachios.pdf.
Notes
This presentation is faithful to the original, with only a few minor changes to presentation. Some grammar and punctuation was cleaned up to improve readability. In the original, references appear alphabetically; here they appear in order of appearance, by wiki design. In the original an image from ShutterStock was included; it was not added here because its not clear if the image can technically be included as Creative Commons content. Otherwise, in accordance with the NoDerivatives portion of the original license, nothing else has been changed.
