Difference between revisions of "File:Fig7 Jikomes SciReports2018 8.jpg"
From LIMSWiki
Jump to navigationJump to searchShawndouglas (talk | contribs) (Added summary) |
Shawndouglas (talk | contribs) ({{Information |Description='''Figure 7.''' Distribution of THC-to-CBD Ratios Vary Across Popular Commercial Strain Names and Between Labs. THC-to-CBD ratios plotted on a logarithmic scale for cannabis flower samples across twenty-three popular commerci...) |
||
| Line 1: | Line 1: | ||
==Summary== | == Summary == | ||
{{Information | {{Information | ||
|Description='''Figure 7.''' Distribution of THC-to-CBD Ratios Vary Across Popular Commercial Strain Names and Between Labs. THC-to-CBD ratios plotted on a logarithmic scale for cannabis flower samples across twenty-three popular commercial strain names for the single lab (Lab A) reporting the lowest '''(a)''' and the single lab (Lab F) reporting the highest '''(b)''' overall THC levels for cannabis flower. |Source={{cite journal |title=The cannabinoid content of legal cannabis in Washington State varies systematically across testing facilities and popular consumer products |journal=Scientific Reports |author=Jikomes, N.; Zoorob, M. |volume=8 |pages=4519 |year=2018 |doi=10.1038/s41598-018-22755-2}} | |Description='''Figure 7.''' Distribution of THC-to-CBD Ratios Vary Across Popular Commercial Strain Names and Between Labs. THC-to-CBD ratios plotted on a logarithmic scale for cannabis flower samples across twenty-three popular commercial strain names for the single lab (Lab A) reporting the lowest '''(a)''' and the single lab (Lab F) reporting the highest '''(b)''' overall THC levels for cannabis flower. |Source={{cite journal |title=The cannabinoid content of legal cannabis in Washington State varies systematically across testing facilities and popular consumer products |journal=Scientific Reports |author=Jikomes, N.; Zoorob, M. |volume=8 |pages=4519 |year=2018 |doi=10.1038/s41598-018-22755-2}} | ||
Revision as of 21:35, 5 April 2019
Summary
| Description |
Figure 7. Distribution of THC-to-CBD Ratios Vary Across Popular Commercial Strain Names and Between Labs. THC-to-CBD ratios plotted on a logarithmic scale for cannabis flower samples across twenty-three popular commercial strain names for the single lab (Lab A) reporting the lowest (a) and the single lab (Lab F) reporting the highest (b) overall THC levels for cannabis flower. |
|---|---|
| Source |
Jikomes, N.; Zoorob, M. (2018). "The cannabinoid content of legal cannabis in Washington State varies systematically across testing facilities and popular consumer products". Scientific Reports 8: 4519. doi:10.1038/s41598-018-22755-2. |
| Date |
2018 |
| Author |
Jikomes, N.; Zoorob, M. |
| Permission (Reusing this file) |
|
| Other versions |
Licensing
|
|
This work is licensed under the Creative Commons Attribution 4.0 License. |
File history
Click on a date/time to view the file as it appeared at that time.
| Date/Time | Thumbnail | Dimensions | User | Comment | |
|---|---|---|---|---|---|
| current | 21:34, 5 April 2019 | 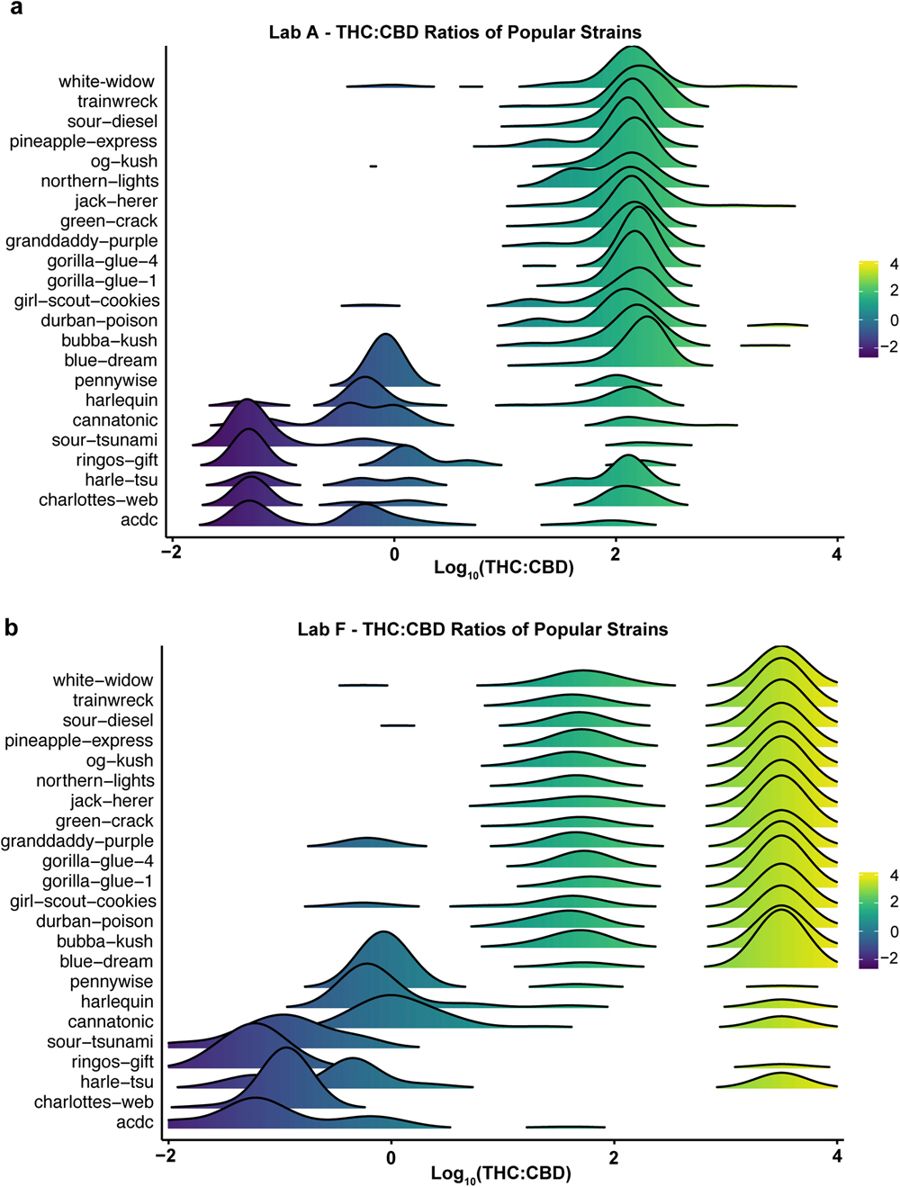 | 900 × 1,187 (134 KB) | Shawndouglas (talk | contribs) | {{Information |Description='''Figure 7.''' Distribution of THC-to-CBD Ratios Vary Across Popular Commercial Strain Names and Between Labs. THC-to-CBD ratios plotted on a logarithmic scale for cannabis flower samples across twenty-three popular commerci... |
You cannot overwrite this file.


