Difference between revisions of "File:Fig4 Jikomes SciReports2018 8.jpg"
Shawndouglas (talk | contribs) (Added summary) |
Shawndouglas (talk | contribs) ({{Information |Description='''Figure 4.''' Labs differ in the propensity to detect low levels of CBD in chemotype I flower. '''(a)''' Kernel density plots of each lab’s distribution of total CBD levels below 1.0% dry weight for chemotype I flower (y-...) |
||
| Line 1: | Line 1: | ||
==Summary== | == Summary == | ||
{{Information | {{Information | ||
|Description='''Figure 4.''' Labs differ in the propensity to detect low levels of CBD in chemotype I flower. '''(a)''' Kernel density plots of each lab’s distribution of total CBD levels below 1.0% dry weight for chemotype I flower (y-axis scaled to one). Most labs show a local maximum near 0.1% total CBD, which is a commonly reported LOQ. '''(b)''' Fraction of chemotype I flower with total CBD levels below 0.1% dry weight. Bars indicate proportions +/− 95% CI for a binomial proportion. '''(c)''' Effect size matrix indicating the magnitude of interlab differences shown in panel B. Effect size is quantified as Cohen’s h (see Methods). |Source={{cite journal |title=The cannabinoid content of legal cannabis in Washington State varies systematically across testing facilities and popular consumer products |journal=Scientific Reports |author=Jikomes, N.; Zoorob, M. |volume=8 |pages=4519 |year=2018 |doi=10.1038/s41598-018-22755-2}} | |Description='''Figure 4.''' Labs differ in the propensity to detect low levels of CBD in chemotype I flower. '''(a)''' Kernel density plots of each lab’s distribution of total CBD levels below 1.0% dry weight for chemotype I flower (y-axis scaled to one). Most labs show a local maximum near 0.1% total CBD, which is a commonly reported LOQ. '''(b)''' Fraction of chemotype I flower with total CBD levels below 0.1% dry weight. Bars indicate proportions +/− 95% CI for a binomial proportion. '''(c)''' Effect size matrix indicating the magnitude of interlab differences shown in panel B. Effect size is quantified as Cohen’s h (see Methods). |Source={{cite journal |title=The cannabinoid content of legal cannabis in Washington State varies systematically across testing facilities and popular consumer products |journal=Scientific Reports |author=Jikomes, N.; Zoorob, M. |volume=8 |pages=4519 |year=2018 |doi=10.1038/s41598-018-22755-2}} | ||
| Line 6: | Line 6: | ||
|Permission=[https://creativecommons.org/licenses/by/4.0/ Creative Commons Attribution 4.0 International] | |Permission=[https://creativecommons.org/licenses/by/4.0/ Creative Commons Attribution 4.0 International] | ||
}} | }} | ||
== Licensing == | == Licensing == | ||
{{cc-by-4.0}} | {{cc-by-4.0}} | ||
Revision as of 21:32, 5 April 2019
Summary
| Description |
Figure 4. Labs differ in the propensity to detect low levels of CBD in chemotype I flower. (a) Kernel density plots of each lab’s distribution of total CBD levels below 1.0% dry weight for chemotype I flower (y-axis scaled to one). Most labs show a local maximum near 0.1% total CBD, which is a commonly reported LOQ. (b) Fraction of chemotype I flower with total CBD levels below 0.1% dry weight. Bars indicate proportions +/− 95% CI for a binomial proportion. (c) Effect size matrix indicating the magnitude of interlab differences shown in panel B. Effect size is quantified as Cohen’s h (see Methods). |
|---|---|
| Source |
Jikomes, N.; Zoorob, M. (2018). "The cannabinoid content of legal cannabis in Washington State varies systematically across testing facilities and popular consumer products". Scientific Reports 8: 4519. doi:10.1038/s41598-018-22755-2. |
| Date |
2018 |
| Author |
Jikomes, N.; Zoorob, M. |
| Permission (Reusing this file) |
|
| Other versions |
Licensing
|
|
This work is licensed under the Creative Commons Attribution 4.0 License. |
File history
Click on a date/time to view the file as it appeared at that time.
| Date/Time | Thumbnail | Dimensions | User | Comment | |
|---|---|---|---|---|---|
| current | 21:32, 5 April 2019 | 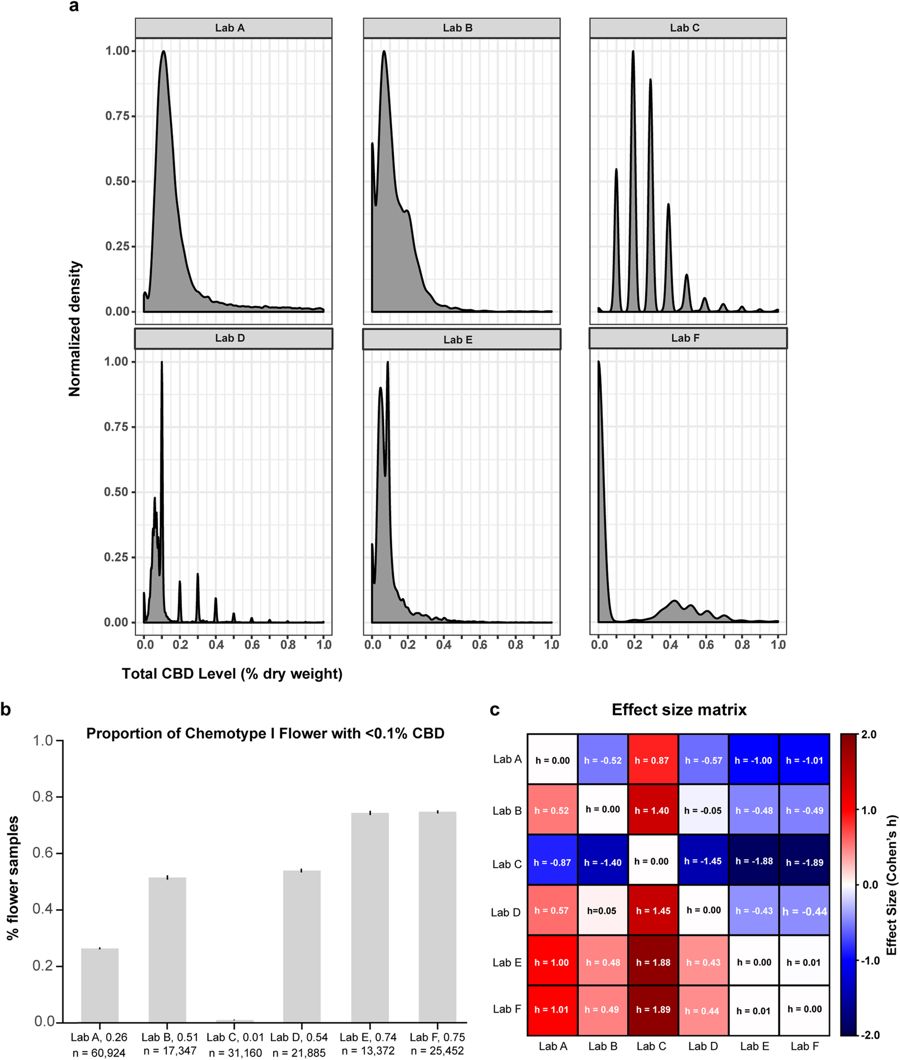 | 900 × 1,060 (111 KB) | Shawndouglas (talk | contribs) | {{Information |Description='''Figure 4.''' Labs differ in the propensity to detect low levels of CBD in chemotype I flower. '''(a)''' Kernel density plots of each lab’s distribution of total CBD levels below 1.0% dry weight for chemotype I flower (y-... |
You cannot overwrite this file.


