Difference between revisions of "File:Fig2 Foysal Sensors2019 19-21.png"
From LIMSWiki
Jump to navigationJump to searchShawndouglas (talk | contribs) |
Shawndouglas (talk | contribs) (Added summary.) |
||
| Line 1: | Line 1: | ||
==Summary== | |||
{{Information | |||
|Description='''Figure 2.''' ('''a''') Sample LFA strip and ('''b''') region of interest of an LFA strip with an analyte. The intensity and density of red color in the test line region determine the amount of analyte in the sample. | |||
|Source={{cite journal |title=Analyte Quantity Detection from Lateral Flow Assay Using a Smartphone |journal=Sensors |author=Foysal, K.H.; Seo, S.E.; Kim. M.J.; Kwon, O.S.; Ching, J.W. |volume=19 |issue=21 |at=4812 |year=2019 |doi=10.3390/s19214812}} | |||
|Author=Foysal, K.H.; Seo, S.E.; Kim. M.J.; Kwon, O.S.; Ching, J.W | |||
|Date=2019 | |||
|Permission=[http://creativecommons.org/licenses/by/4.0/ Creative Commons Attribution 4.0 International] | |||
}} | |||
== Licensing == | == Licensing == | ||
{{cc-by-4.0}} | {{cc-by-4.0}} | ||
Latest revision as of 22:30, 9 April 2020
Summary
| Description |
Figure 2. (a) Sample LFA strip and (b) region of interest of an LFA strip with an analyte. The intensity and density of red color in the test line region determine the amount of analyte in the sample. |
|---|---|
| Source |
Foysal, K.H.; Seo, S.E.; Kim. M.J.; Kwon, O.S.; Ching, J.W. (2019). "Analyte Quantity Detection from Lateral Flow Assay Using a Smartphone". Sensors 19 (21): 4812. doi:10.3390/s19214812. |
| Date |
2019 |
| Author |
Foysal, K.H.; Seo, S.E.; Kim. M.J.; Kwon, O.S.; Ching, J.W |
| Permission (Reusing this file) |
|
| Other versions |
Licensing
|
|
This work is licensed under the Creative Commons Attribution 4.0 License. |
File history
Click on a date/time to view the file as it appeared at that time.
| Date/Time | Thumbnail | Dimensions | User | Comment | |
|---|---|---|---|---|---|
| current | 22:27, 9 April 2020 | 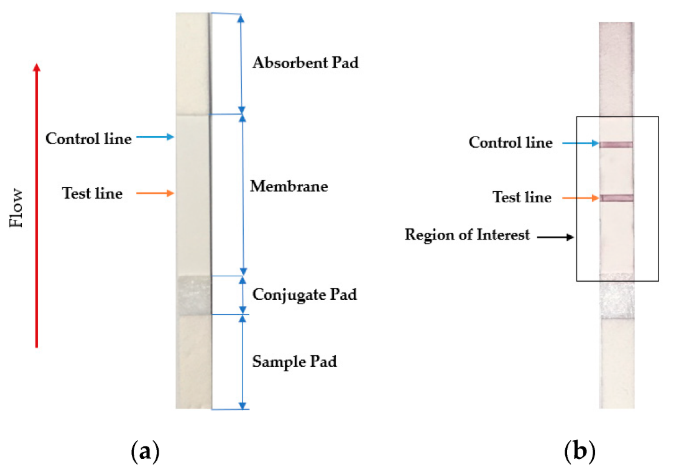 | 677 × 473 (82 KB) | Shawndouglas (talk | contribs) |
You cannot overwrite this file.
File usage
The following 4 pages use this file:
- Template:COVID-19 Testing, Reporting, and Information Management in the Laboratory/Diagnostic testing of COVID-19 and other coronaviruses/Testing terminology
- Template:Diagnostic testing of COVID-19 and other coronaviruses
- LII:COVID-19 Testing, Reporting, and Information Management in the Laboratory/Diagnostic testing of COVID-19 and other coronaviruses
- Book:COVID-19 Testing, Reporting, and Information Management in the Laboratory/Diagnostic testing of COVID-19 and other coronaviruses/Testing terminology


