Difference between revisions of "File:Fig2 Backman BMCBio2016 17.gif"
Shawndouglas (talk | contribs) |
Shawndouglas (talk | contribs) (A) |
||
| Line 1: | Line 1: | ||
==Summary== | |||
{{Information | |||
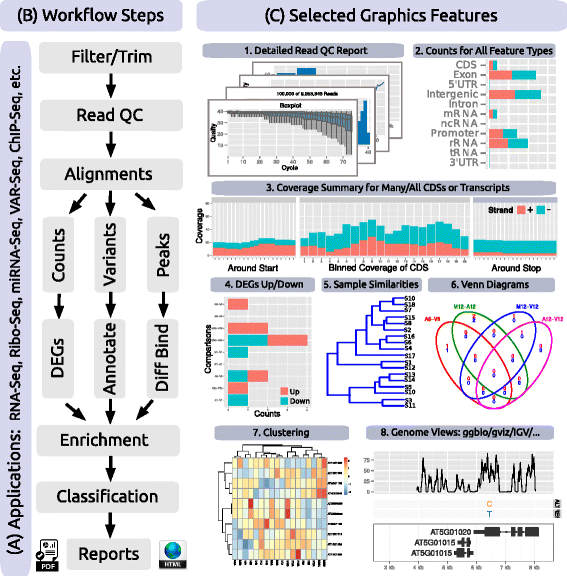
|Description='''Figure 2.''' Workflow Steps and Graphical Features. Relevant workflow steps of several NGS applications ('''a''') are illustrated in form of a simplified flowchart ('''b'''). Examples of systemPipeR’s functionalities are given under ('''c''') including: (1) eight different plots for summarizing the quality and diversity of short reads provided as FASTQ files; (2) strand-specific read count summaries for all feature types provided by a genome annotation; (3) summary plots of read depth coverage for any number of transcripts with nucleotide resolution upstream/downstream of their start and stop codons, as well as binned coverage for their coding regions; (4) enumeration of up- and down-regulated DEGs for user defined sample comparisons; (5) similarity clustering of sample profiles; (6) 2-5-way Venn diagrams for DEGs, peak and variant sets; (7) gene-wise clustering with a wide range of algorithms; and (8) support for plotting read pileups and variants in the context of genome annotations along with genome browser support. | |||
|Source={{cite journal |title=systemPipeR: NGS workflow and report generation environment |journal=BMC Bioinformatics |author=Backman, T.W.H.; Girke, T. |volume=17 |page=388 |year=2016 |doi=10.1186/s12859-016-1241-0}} | |||
|Author=Backman, T.W.H.; Girke, T. | |||
|Date=2016 | |||
|Permission=[http://creativecommons.org/licenses/by/4.0/ Creative Commons Attribution 4.0 International] | |||
}} | |||
== Licensing == | == Licensing == | ||
{{cc-by-4.0}} | {{cc-by-4.0}} | ||
Latest revision as of 22:24, 20 August 2018
Summary
| Description |
Figure 2. Workflow Steps and Graphical Features. Relevant workflow steps of several NGS applications (a) are illustrated in form of a simplified flowchart (b). Examples of systemPipeR’s functionalities are given under (c) including: (1) eight different plots for summarizing the quality and diversity of short reads provided as FASTQ files; (2) strand-specific read count summaries for all feature types provided by a genome annotation; (3) summary plots of read depth coverage for any number of transcripts with nucleotide resolution upstream/downstream of their start and stop codons, as well as binned coverage for their coding regions; (4) enumeration of up- and down-regulated DEGs for user defined sample comparisons; (5) similarity clustering of sample profiles; (6) 2-5-way Venn diagrams for DEGs, peak and variant sets; (7) gene-wise clustering with a wide range of algorithms; and (8) support for plotting read pileups and variants in the context of genome annotations along with genome browser support. |
|---|---|
| Source |
Backman, T.W.H.; Girke, T. (2016). "systemPipeR: NGS workflow and report generation environment". BMC Bioinformatics 17: 388. doi:10.1186/s12859-016-1241-0. |
| Date |
2016 |
| Author |
Backman, T.W.H.; Girke, T. |
| Permission (Reusing this file) |
|
| Other versions |
Licensing
|
|
This work is licensed under the Creative Commons Attribution 4.0 License. |
File history
Click on a date/time to view the file as it appeared at that time.
| Date/Time | Thumbnail | Dimensions | User | Comment | |
|---|---|---|---|---|---|
| current | 22:22, 20 August 2018 |  | 567 × 576 (187 KB) | Shawndouglas (talk | contribs) |
You cannot overwrite this file.
File usage
The following 2 pages use this file:


