Difference between revisions of "File:Fig2 Andellini BMCMedInfoDecMak2017 17-1.gif"
Shawndouglas (talk | contribs) |
Shawndouglas (talk | contribs) (Added summary.) |
||
| Line 1: | Line 1: | ||
==Summary== | |||
{{Information | |||
|Description='''Figure 2.''' The cyclical process to be followed after completing the first year protocol. The combination of the two figures shows the entire clinical pathway applied to the patients, which is the final process to be managed by the BPM application. These two activity diagrams were the main output of the process definition phase. The filled circle represents the starting point for the process. The rectangles with rounded corners represent tasks or activities, and in this case represent the group of tests to be performed. The rectangles in the background layer represent the periods when the tasks are performed. | |||
|Source={{cite journal |title=Experimental application of business process management technology to manage clinical pathways: A pediatric kidney transplantation follow-up case |journal=BMC Medical Informatics and Decision Making |author=Andellini, M.; Riesgo, S.F.; Morolli, F.; Ritrovato, M.; Cosoli, P.; Petruzzellis, S.; Rosso, N. |volume=17 |issue=1 |pages=151 |year=2017 |doi=10.1186/s12911-017-0546-x |pmid=29100512}} | |||
|Author=Andellini, M.; Riesgo, S.F.; Morolli, F.; Ritrovato, M.; Cosoli, P.; Petruzzellis, S.; Rosso, N. | |||
|Date=2017 | |||
|Permission=[http://creativecommons.org/licenses/by/4.0/ Creative Commons Attribution 4.0 International] | |||
}} | |||
== Licensing == | == Licensing == | ||
{{cc-by-4.0}} | {{cc-by-4.0}} | ||
Latest revision as of 23:22, 13 November 2017
Summary
| Description |
Figure 2. The cyclical process to be followed after completing the first year protocol. The combination of the two figures shows the entire clinical pathway applied to the patients, which is the final process to be managed by the BPM application. These two activity diagrams were the main output of the process definition phase. The filled circle represents the starting point for the process. The rectangles with rounded corners represent tasks or activities, and in this case represent the group of tests to be performed. The rectangles in the background layer represent the periods when the tasks are performed. |
|---|---|
| Source |
Andellini, M.; Riesgo, S.F.; Morolli, F.; Ritrovato, M.; Cosoli, P.; Petruzzellis, S.; Rosso, N. (2017). "Experimental application of business process management technology to manage clinical pathways: A pediatric kidney transplantation follow-up case". BMC Medical Informatics and Decision Making 17 (1): 151. doi:10.1186/s12911-017-0546-x. PMID 29100512. |
| Date |
2017 |
| Author |
Andellini, M.; Riesgo, S.F.; Morolli, F.; Ritrovato, M.; Cosoli, P.; Petruzzellis, S.; Rosso, N. |
| Permission (Reusing this file) |
|
| Other versions |
Licensing
|
|
This work is licensed under the Creative Commons Attribution 4.0 License. |
File history
Click on a date/time to view the file as it appeared at that time.
| Date/Time | Thumbnail | Dimensions | User | Comment | |
|---|---|---|---|---|---|
| current | 23:20, 13 November 2017 | 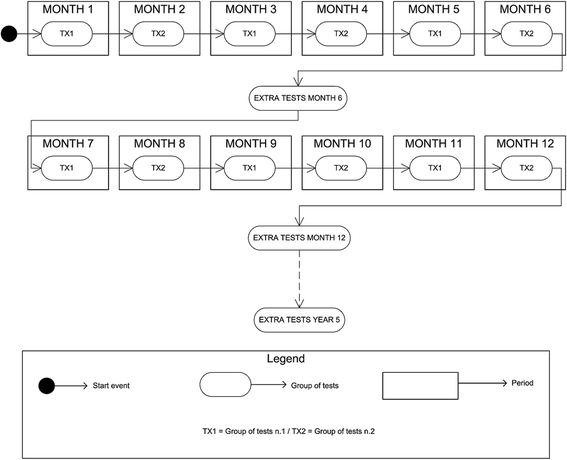 | 567 × 460 (35 KB) | Shawndouglas (talk | contribs) |
You cannot overwrite this file.


