Journal:Use of middleware data to dissect and optimize hematology autoverification
| Full article title | Use of middleware data to dissect and optimize hematology autoverification |
|---|---|
| Journal | Journal of Pathology Informatics |
| Author(s) | Starks, Rachel D.; Merrill, Anna E.; Davis, Scott R.; Voss, Dena R.; Goldsmith, Pamela, J.; Brown, Bonnie S.; Kulhavy, Jeff; Krasowski, Matthew D. |
| Author affiliation(s) | University of Iowa Hospitals and Clinics |
| Primary contact | Log-in required |
| Year published | 2021 |
| Volume and issue | 12 |
| Page(s) | 19 |
| DOI | 10.4103/jpi.jpi_89_20 |
| ISSN | 2153-3539 |
| Distribution license | Creative Commons Attribution-NonCommercial-ShareAlike 4.0 International |
| Website | https://www.jpathinformatics.org/text.asp?2021/12/1/19/313145 |
| Download | https://www.jpathinformatics.org/temp/JPatholInform12119-643471_175227.pdf (PDF) |
|
|
This article should be considered a work in progress and incomplete. Consider this article incomplete until this notice is removed. |
Abstract
Background: Hematology analysis comprises some of the highest volume tests run in clinical laboratories. Autoverification of hematology results using computer-based rules reduces turnaround time for many specimens, while strategically targeting specimen review by technologist or pathologist.
Methods: Autoverification rules had been developed over a decade at an 800-bed tertiary/quarternary care academic medical central laboratory serving both adult and pediatric populations. In the process of migrating to newer hematology instruments, we analyzed the rates of the autoverification rules/flags most commonly associated with triggering manual review. We were particularly interested in rules that on their own often led to manual review in the absence of other flags. Prior to the study, autoverification rates were 87.8% (out of 16,073 orders) for complete blood count (CBC) if ordered as a panel and 85.8% (out of 1,940 orders) for CBC components ordered individually (not as the panel).
Results: Detailed analysis of rules/flags that frequently triggered indicated that the immature granulocyte (IG) flag (an instrument parameter) and rules that reflexed platelet by impedance method (PLT-I) to platelet by fluorescent method (PLT-F) represented the two biggest opportunities to increase autoverification. The IG flag threshold had previously been validated at 2%, a setting that resulted in this flag alone preventing autoverification in 6.0% of all samples. The IG flag threshold was raised to 5% after detailed chart review; this was also the instrument vendor's default recommendation for the newer hematology analyzers. Analysis also supported switching to PLT-F for all platelet analysis. Autoverification rates increased to 93.5% (out of 91,692 orders) for CBC as a panel and 89.8% (out of 11,982 orders) for individual components after changes in rules and laboratory practice.
Conclusions: Detailed analysis of autoverification of hematology testing at an academic medical center clinical laboratory that had been using a set of autoverification rules for over a decade revealed opportunities to optimize the parameters. The data analysis was challenging and time-consuming, highlighting opportunities for improvement in software tools that allow for more rapid and routine evaluation of autoverification parameters.
Keywords: algorithms, clinical laboratory information system, hematology, informatics, middleware
Introduction
In the realm of laboratory information system (LIS) and/or middleware software, autoverification refers to the use of computer-based rules to determine the appropriate release of laboratory test results. With the expansion of data management systems in the lab, autoverification is now a routine practice in core clinical laboratories[1][2][3][4], where the use of well-designed autoverification rules improves both quality and efficiency.[1][2][4] Over the years, autoverification rules have been described in detail for clinical chemistry, blood gas, and coagulation analysis, often achieving autoverification rates of >90%.[5][6][7][8][9][10][11][12]
In contrast, published studies regarding the application of autoverification in hematopathology are more limited.[13][14] Zhao et al. describe the implementation of autoverification rules in hematology analysis in a multicenter setting with 76%–85% autoverification rates.[14] The necessity of manual review of peripheral blood smears precludes achieving the high autoverification rates seen in clinical chemistry. On the other hand, high rates of manual review may place a strain on limited laboratory resources and delay turnaround time without adding clinical value. In 2005, The International Consensus Group for Hematology (ICGH) issued guidelines to establish a uniform set of criteria for manual review of automated hematology testing.[15][16][17][18] The proposed criteria for manual review includes quantitative and qualitative parameters. Pratumvinit et al. optimized the ICGH guidelines to significantly reduce their review rates and increase autoverification.[18] The basic qualitative criteria used for manual review are well-established; however, the specific quantitative cutoffs to trigger manual review are largely set by the individual laboratory, with some recommendations for individual parameters provided by instrument vendors or published literature.[7][15][16][19][20][21] Individual laboratories ideally should optimize their own set of rules to maintain both quality and efficiency within their own context of instrumentation, staffing, and patient population. However, data analysis on specific flags and their clinical impact may be quite challenging to assess.
In this study, we evaluated autoverification rules at an 800-bed tertiary/quarternary academic medical center core clinical laboratory for a complete blood count (CBC) with white blood cell (WBC) count differential (Diff) and the “a la carte” ordering of individual CBC components. The laboratory had developed and validated autoverification protocols over a decade. Feedback from laboratory staff suggested that some rules were resulting in manual review without clear clinical benefit. We therefore sought opportunities for improvement by assessing the flags that most frequently held specimens for manual review. Our analysis also illustrates some of the data analytical challenges associated with evaluating hematology autoverification.
Methods
Institutional details
The present study was performed at an approximately 800-bed tertiary/quaternary care academic medical center. The medical center services included pediatric and adult inpatient units, multiple intensive care units (ICUs), a level I trauma-capable emergency treatment center, and outpatient services. Pediatric and adult hematology/oncology services include both inpatient and outpatient populations. For the purpose of this study, patients 18 years and older were classified as adults, with pediatric patients < 18-years old. The data in the study were collected as part of a retrospective study approved by the university Institutional Review Board (protocol #201801719) covering the time period from January 1, 2018, to July 31, 2018. This study was carried out in accordance with the Code of Ethics of the World Medical Association (declaration of Helsinki).
Data extraction and analysis
The electronic health record (EHR) throughout the retrospective study period was Epic (Epic Systems, Inc., Madison, Wisconsin, USA), which has been in place since May 2009. The middleware software was Data Innovations (DI) Instrument Manager (DI, Burlington Vermont, USA) version 8.14, with the autoverification rules predominantly contained within the DI middleware.[5][22] The LIS was Epic Beaker Clinical Pathology.[23] Data were extracted from DI using Microsoft Open Database Connectivity (Microsoft Corporation, Redmond, Washington, USA) and analyzed using Microsoft Excel. Instrument flag data were retrieved from the analyzer and required extensive data cleanup and manual review to assure integrity. One major challenge is that the error messages concatenate on one another in a variety of combinations. Additional File 1 (see Notes at bottom) shows an example of the data, de-identified to remove identifying data fields related to accession number, dates/times, and personnel performing the testing. The flag fields are not transmitted to Epic Beaker Clinical Pathology[23] nor are the operation identification numbers that specify who reviewed, released, and rejected results. These fields would be needed to calculate percent autoverification in the LIS if that were a goal.
Instrument flags
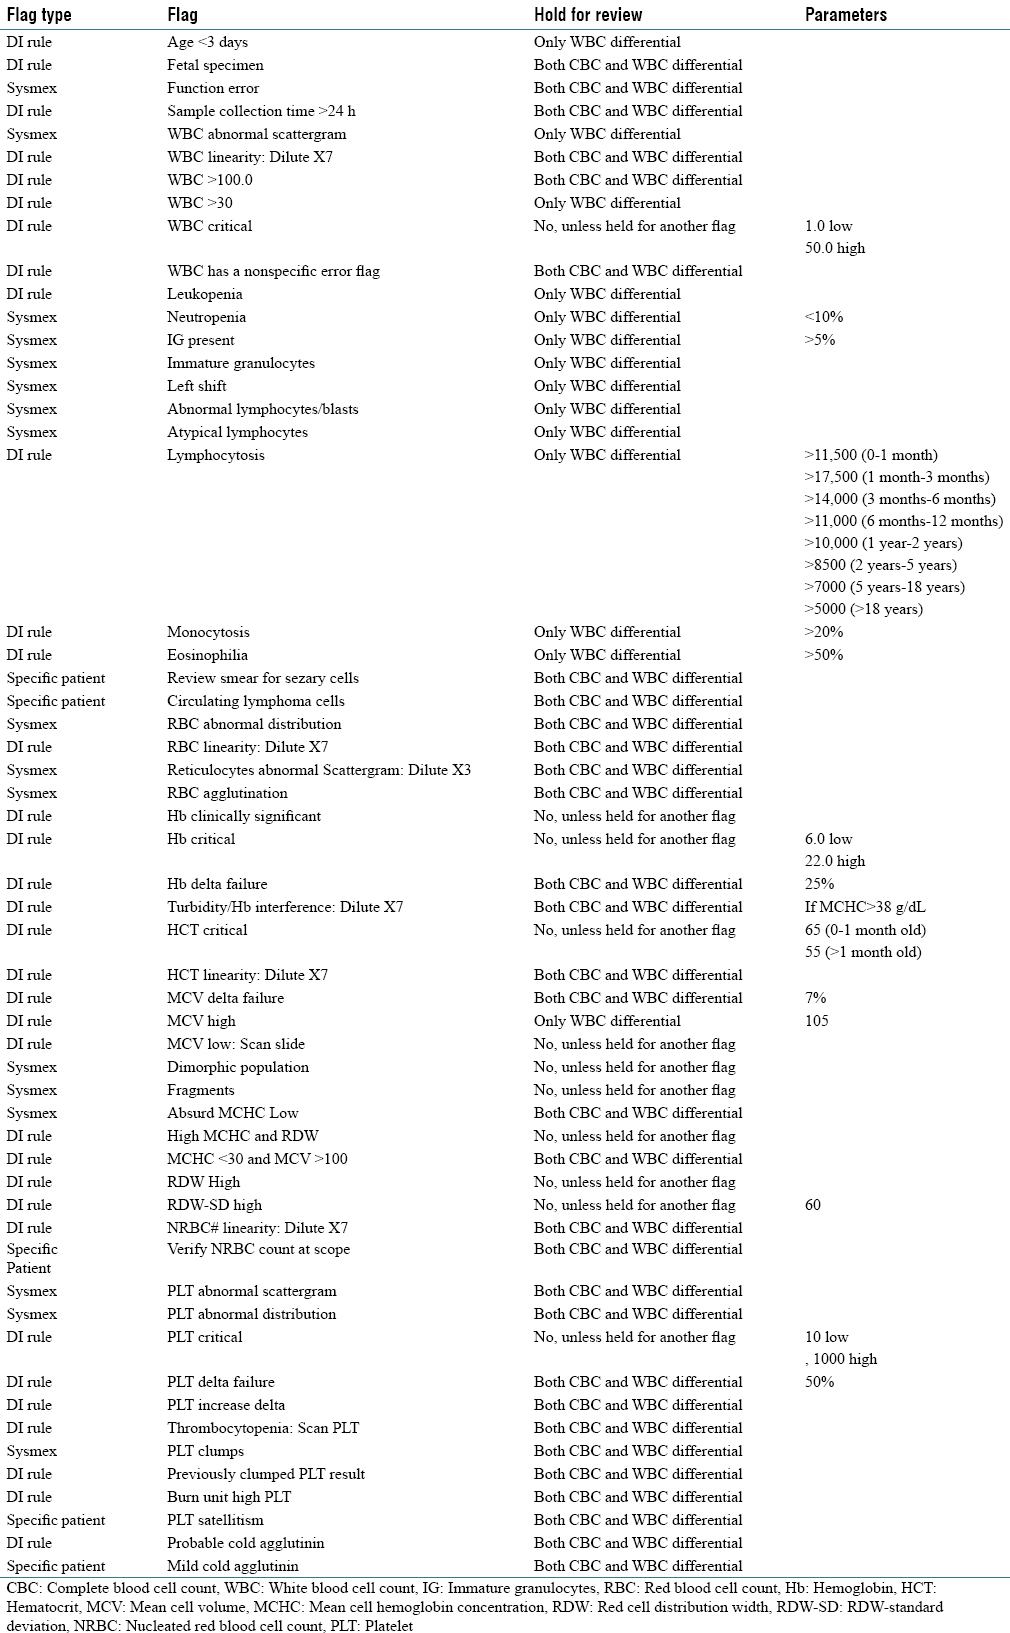
In our laboratory, instrument flags are generated either from the automated hematology instrument manufacturer (Sysmex, America) or by our own laboratory-validated rules built in middleware (summarized in Table 1, and indicating origin of rule). These flags are either global (i.e., applied to every sample) or patient-specific (e.g., a patient known to have previous samples that required special handling or analysis). When a sample triggers a flag, several outcomes are possible: (1) automatically release the CBC component results but hold the WBC Diff for manual review, (2) hold both the CBC and WBC Diff for manual review, and (3) release all results to the LIS/EHR without manual review (assuming no other flags intervene). For example, the flag for the presence of immature granulocytes (IG) above a set percentage will hold only the WBC Diff and release the CBC, while the thrombocytopenia flag will hold both the CBC and WBC Diff for manual review. IGs on manual review include metamyelocytes, myelocytes, and promyelocytes. Critical value flags, in the absence of other flags, do not preclude autoverification; notification of the clinical services for critical values is by telephone per protocol.
|
Automated analyzers
Automated hematology testing was performed by a Sysmex XN-9000 hematology analyzer with a fully automated hematology slide preparation and staining system (Sysmex America, Inc., Lincolnshire, Illinois, USA). This instrument performs platelet (PLT) enumeration either by disruption of electrical current (PLT-I) or by a flow cytometric method using a fluorescent oxazine dye (PLT-F). Briefly, for the PLT-F method, the dye binds to platelet organelles, is then irradiated by laser beam, and the corresponding forward-scattered light and side-scattered fluorescence are plotted.[24] The PLT-F method better distinguishes between platelets and fragmented red blood cells.[24][25][26] During the timeframe for the present study, PLT-F used higher cost reagents than PLT-I (approximately 50% more at onset of project).
Results
Volume of testing and frequency of flags
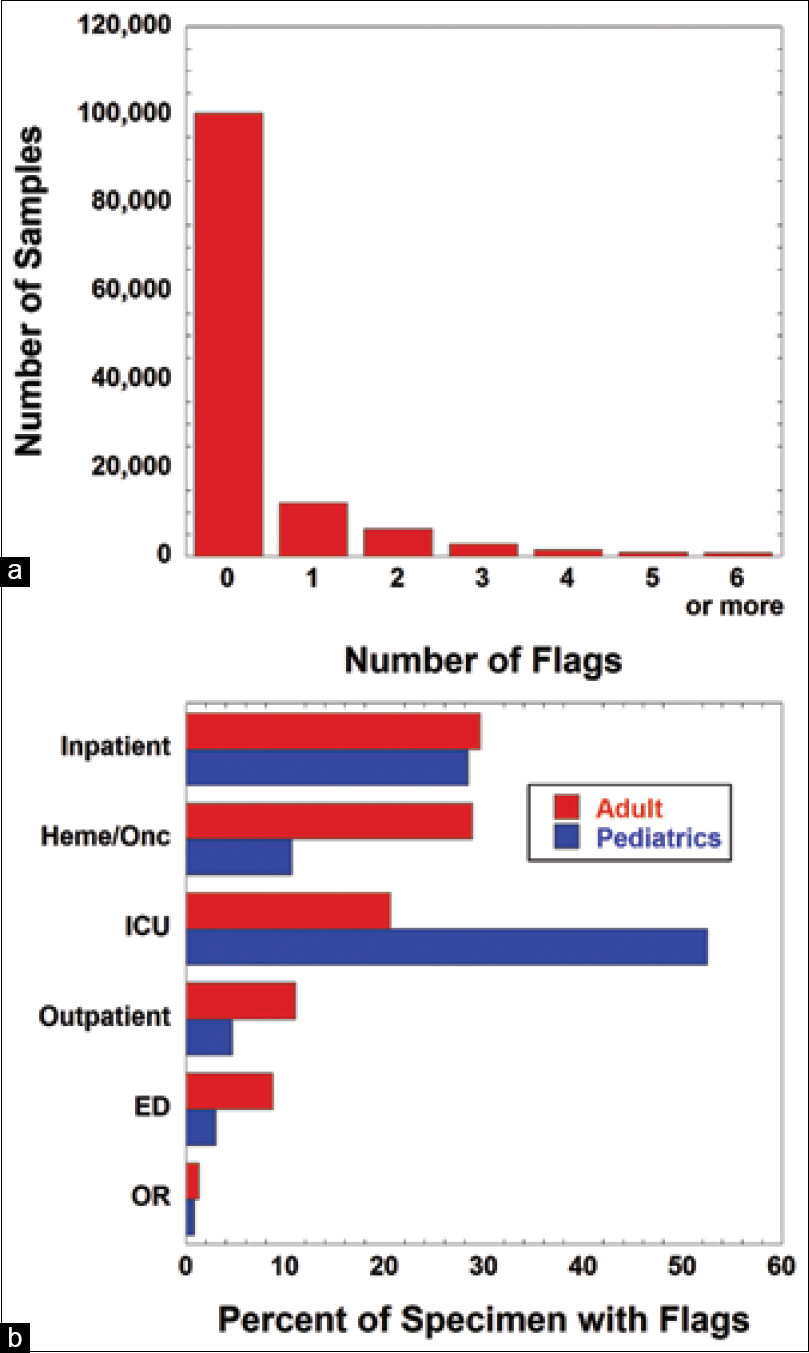
Over a six-month period, a total of 132,432 specimens had CBC with or without WBC Diff or an a la carte order for individual CBC components (PLT, hemoglobin, and hematocrit). Manual review by a technologist was performed on 10,314 of those specimens (7.8%). During this period, a total of 53,396 instrument flags were triggered (note that an individual specimen may trigger up to 15 flags), with 80.3% of samples not associated with any flag. Overall, 9.7% of specimens triggered a single flag, 5.0% triggered two flags, and < 1% of samples triggered five or more flags (Figure 1a).
Pediatric ICUs (including both neonatal and pediatric units) had the highest percentage of flagged samples, with one or more flags on 52.5% of specimens (Figure 1b). Adult and pediatric non-ICU inpatient units had 29.6% and 28.4% samples, respectively, with at least one flag. Adult hematology/oncology services, which include both an inpatient bone marrow transplant unit and outpatient clinics, had a 28.8% rate of samples with one or more flags. Rate of sample flags was much lower in outpatient (excluding hematology/oncology), emergency department, and operating room locations, at approximately 10% or less in both adult and pediatric populations.
|
Frequently triggered flags
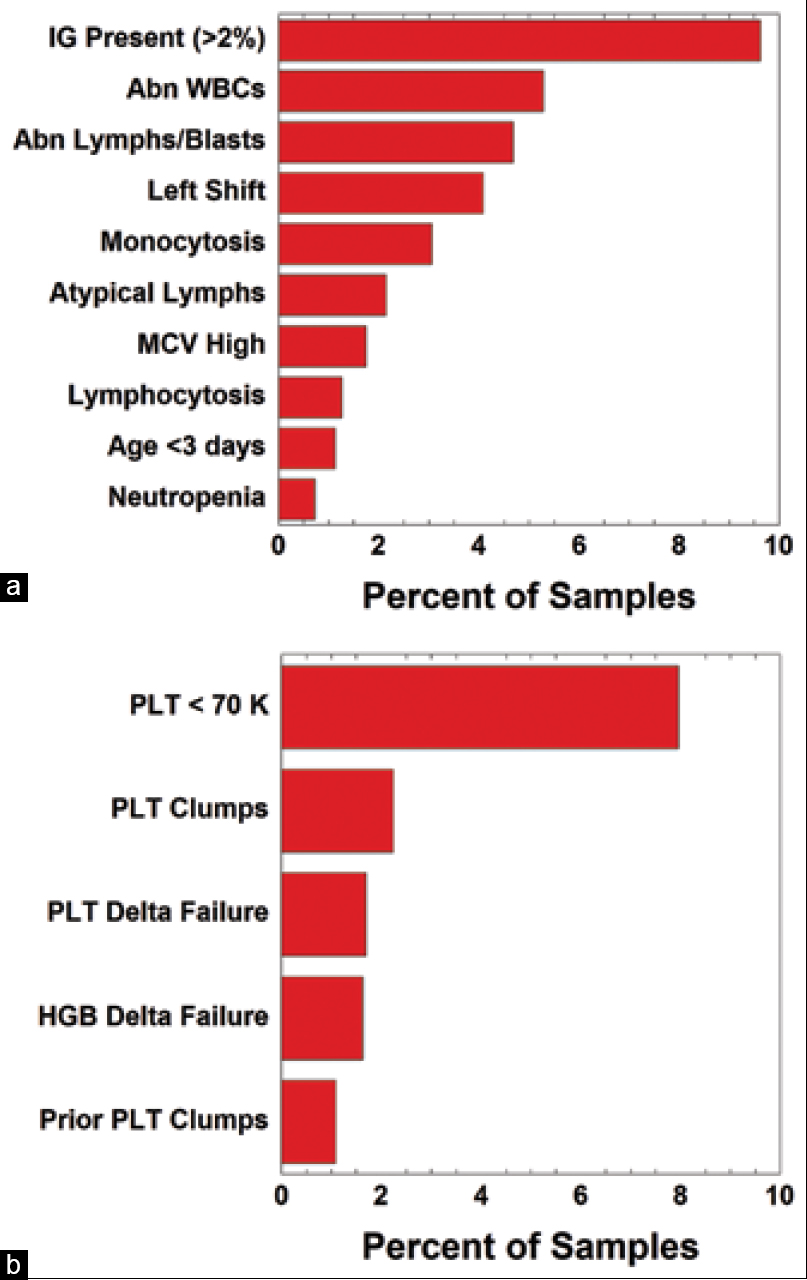
To analyze the patterns of flags that frequently triggered manual review for both WBC and PLT parameters, we began by reviewing WBC parameters. This was limited to a 30-day period of analysis due to the extensive nature of data cleanup and manual review for the middleware and instrument data. We looked at two outcomes: (1) flags that would release the CBC while holding the WBC Diff for manual review and (2) flags that would hold both the CBC and WBC Diff for manual review. In the first category of releasing the CBC and holding the WBC Diff for manual review, the IG present flag represented 9.6% of flags during a 30-day review period (20,576 samples and 1,980 flags) (Figure 2a). The next most frequently triggered flag was the WBC abnormal scattergram at 5.3% (1,087 flags), followed by abnormal lymphocytes or blasts flag at 4.7% (962 flags) (Figure 2a). These top three most frequently triggered flags are instrument flags, with the ≥2% IG cutoff specified by the laboratory (discussed in more detail below).
For platelets, the PLT-I method was the main methodology used to generate a platelet count, with PLT-F used in certain circumstances. Samples were run for PLT-F based on the following flags: (1) PLT-I <70 k/mm3 (“thrombocytopenia”), (2) 50% change in either direction within the last seven days (“delta failure”), (3) pediatric inpatients and pediatric hematology/oncology clinic patients (due to known higher rate of red blood cell fragmentation and other specimen challenges), and/or (4) platelet abnormal distribution flag on the hematology analyzer. For 20,576 samples and 1,637 flags during the review period, we identified PLT-I <70 k/mm3 as accounting for 8.0% of flags that were holding both the CBC and WBC Diff to re-run for PLT-F (Figure 2b). The next most frequently triggered flags to hold CBC and WBC Diff for manual review were PLT clumps (2.2%, 460 flags) and PLT delta failure (1.7%, 349 flags) (Figure 2b).
|
Most frequently triggered single flag
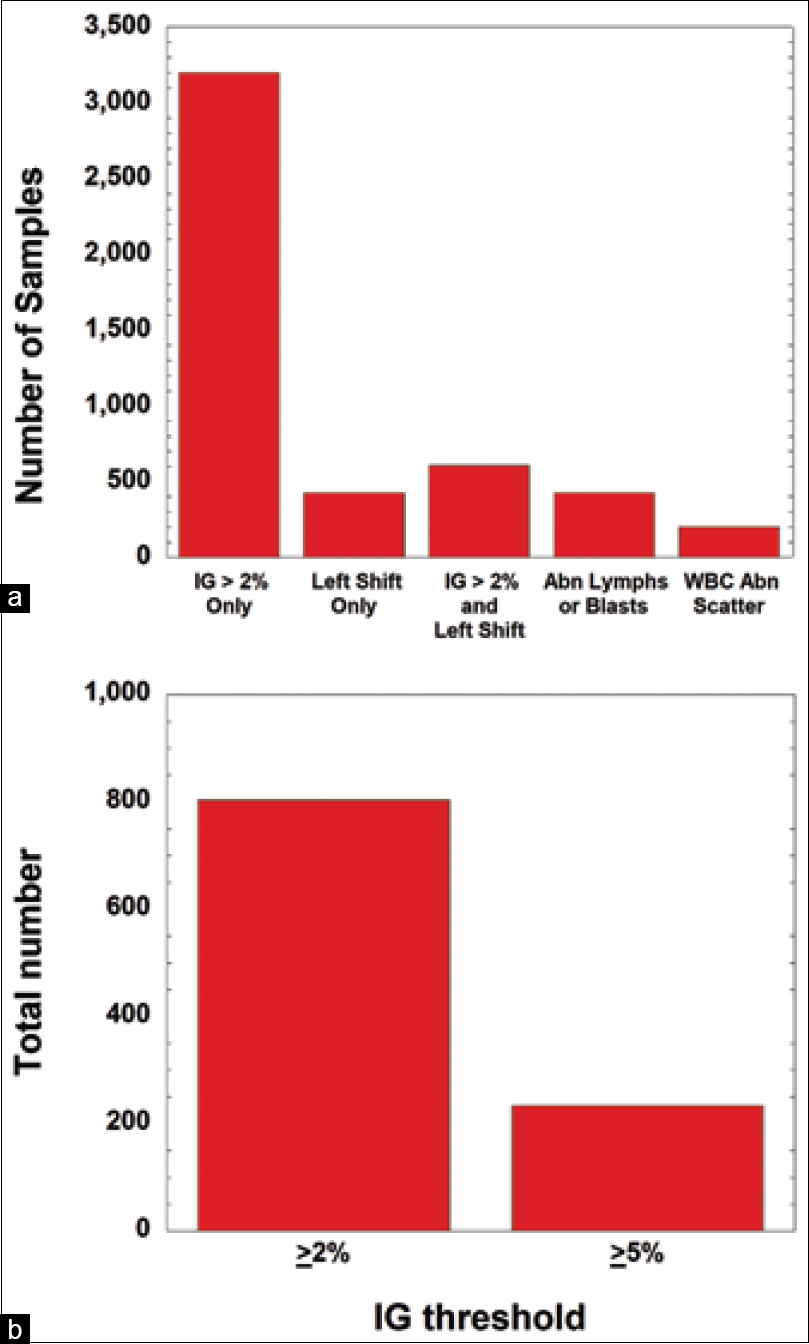
Next, we examined the samples during a six-month period that had only a single flag. By far, the IG flag (intended to detect metamyelocytes, myelocytes, and promyelocytes) was the most frequently triggered single-flag, representing 6.0% of flags (3,200 samples) (Figure 3a). The left shift and the abnormal lymphocyte/blasts flags both represent 0.80% (each 425 flags), while 0.37% of single flags (199 flags) was due to the WBC abnormal scattergram (Figure 3a). All four flags are generated by instrument rules. The left shift flag primarily detects bands and metamyelocytes. In 1.1% of samples, the IG and left shift flags occurred together and were the only flags present (608 flags) (Figure 3a). The difference in manual review rates when the IG cutoff is changed from ≥2% (804 samples) to ≥5% (234 samples) is shown in Figure 3b.
|
Optimization of immature granulocyte flag
References
- ↑ 1.0 1.1 Crolla, Lawrence J.; Westgard, James O. (1 September 2003). "Evaluation of rule-based autoverification protocols". Clinical leadership & management review: the journal of CLMA 17 (5): 268–272. ISSN 1527-3954. PMID 14531220. https://pubmed.ncbi.nlm.nih.gov/14531220.
- ↑ 2.0 2.1 Jones, Jay B. (1 March 2013). "A strategic informatics approach to autoverification". Clinics in Laboratory Medicine 33 (1): 161–181. doi:10.1016/j.cll.2012.11.004. ISSN 1557-9832. PMID 23331736. https://pubmed.ncbi.nlm.nih.gov/23331736.
- ↑ Pearlman, Eugene S.; Bilello, Leonard; Stauffer, Joseph; Kamarinos, Andonios; Miele, Rudolph; Wolfert, Marc S. (1 July 2002). "Implications of autoverification for the clinical laboratory". Clinical leadership & management review: the journal of CLMA 16 (4): 237–239. ISSN 1527-3954. PMID 12168427. https://pubmed.ncbi.nlm.nih.gov/12168427.
- ↑ 4.0 4.1 Torke, Narayan; Boral, Leonard; Nguyen, Tracy; Perri, Angelo; Chakrin, Alan (1 December 2005). "Process improvement and operational efficiency through test result autoverification". Clinical Chemistry 51 (12): 2406–2408. doi:10.1373/clinchem.2005.054395. ISSN 0009-9147. PMID 16306113. https://pubmed.ncbi.nlm.nih.gov/16306113.
- ↑ 5.0 5.1 Krasowski, Matthew D.; Davis, Scott R.; Drees, Denny; Morris, Cory; Kulhavy, Jeff; Crone, Cheri; Bebber, Tami; Clark, Iwa et al. (2014). "Autoverification in a core clinical chemistry laboratory at an academic medical center". Journal of Pathology Informatics 5 (1): 13. doi:10.4103/2153-3539.129450. ISSN 2229-5089. PMC 4023033. PMID 24843824. https://pubmed.ncbi.nlm.nih.gov/24843824.
- ↑ Sediq, Amany Mohy-Eldin; Abdel-Azeez, Ahmad GabAllahm Hala (1 September 2014). "Designing an autoverification system in Zagazig University Hospitals Laboratories: preliminary evaluation on thyroid function profile". Annals of Saudi Medicine 34 (5): 427–432. doi:10.5144/0256-4947.2014.427. ISSN 0975-4466. PMC 6074554. PMID 25827700. https://pubmed.ncbi.nlm.nih.gov/25827700.
- ↑ 7.0 7.1 Onelöv, Liselotte; Gustafsson, Elisabeth; Grönlund, Eva; Andersson, Helena; Hellberg, Gisela; Järnberg, Ingela; Schurow, Sara; Söderblom, Lisbeth et al. (1 October 2016). "Autoverification of routine coagulation assays in a multi-center laboratory". Scandinavian Journal of Clinical and Laboratory Investigation 76 (6): 500–502. doi:10.1080/00365513.2016.1200135. ISSN 1502-7686. PMID 27400327. https://pubmed.ncbi.nlm.nih.gov/27400327.
- ↑ Randell, Edward W.; Short, Garry; Lee, Natasha; Beresford, Allison; Spencer, Margaret; Kennell, Marina; Moores, Zoë; Parry, David (1 June 2018). "Strategy for 90% autoverification of clinical chemistry and immunoassay test results using six sigma process improvement". Data in Brief 18: 1740–1749. doi:10.1016/j.dib.2018.04.080. ISSN 2352-3409. PMC 5998219. PMID 29904674. https://pubmed.ncbi.nlm.nih.gov/29904674.
- ↑ Randell, Edward W.; Short, Garry; Lee, Natasha; Beresford, Allison; Spencer, Margaret; Kennell, Marina; Moores, Zoë; Parry, David (1 May 2018). "Autoverification process improvement by Six Sigma approach: Clinical chemistry & immunoassay". Clinical Biochemistry 55: 42–48. doi:10.1016/j.clinbiochem.2018.03.002. ISSN 1873-2933. PMID 29518383. https://pubmed.ncbi.nlm.nih.gov/29518383.
- ↑ Wu, Jie; Pan, Meichen; Ouyang, Huizhen; Yang, Zhili; Zhang, Qiaoxin; Cai, Yingmu (1 December 2018). "Establishing and Evaluating Autoverification Rules with Intelligent Guidelines for Arterial Blood Gas Analysis in a Clinical Laboratory". SLAS technology 23 (6): 631–640. doi:10.1177/2472630318775311. ISSN 2472-6311. PMID 29787327. https://pubmed.ncbi.nlm.nih.gov/29787327.
- ↑ Randell, Edward W.; Yenice, Sedef; Khine Wamono, Aye Aye; Orth, Matthias (1 November 2019). "Autoverification of test results in the core clinical laboratory". Clinical Biochemistry 73: 11–25. doi:10.1016/j.clinbiochem.2019.08.002. ISSN 1873-2933. PMID 31386832. https://pubmed.ncbi.nlm.nih.gov/31386832.
- ↑ Wang, Zhongqing; Peng, Cheng; Kang, Hui; Fan, Xia; Mu, Runqing; Zhou, Liping; He, Miao; Qu, Bo (3 July 2019). "Design and evaluation of a LIS-based autoverification system for coagulation assays in a core clinical laboratory". BMC medical informatics and decision making 19 (1): 123. doi:10.1186/s12911-019-0848-2. ISSN 1472-6947. PMC 6609390. PMID 31269951. https://pubmed.ncbi.nlm.nih.gov/31269951.
- ↑ Fu, Qiang; Ye, Congxiu; Han, Bo; Zhan, Xiaoxia; Chen, Kang; Huang, Fuda; Miao, Lisao; Yang, Shanhong et al. (1 April 2020). "Designing and Validating Autoverification Rules for Hematology Analysis in Sysmex XN-9000 Hematology System". Clinical Laboratory 66 (4). doi:10.7754/Clin.Lab.2019.190726. ISSN 1433-6510. PMID 32255287. https://pubmed.ncbi.nlm.nih.gov/32255287.
- ↑ 14.0 14.1 Zhao, X.; Wang, X. F.; Wang, J. B.; Lu, X. J.; Zhao, Y. W.; Li, C. B.; Wang, B. H.; Wei, J. et al. (1 April 2016). "Multicenter study of autoverification methods of hematology analysis". Journal of Biological Regulators and Homeostatic Agents 30 (2): 571–577. ISSN 0393-974X. PMID 27358150. https://pubmed.ncbi.nlm.nih.gov/27358150.
- ↑ 15.0 15.1 Buoro, Sabrina; Mecca, Tommaso; Seghezzi, Michela; Manenti, Barbara; Azzarà, Giovanna; Ottomano, Cosimo; Lippi, Giuseppe (1 July 2017). "Validation rules for blood smear revision after automated hematological testing using Mindray CAL-8000". Journal of Clinical Laboratory Analysis 31 (4). doi:10.1002/jcla.22067. ISSN 1098-2825. PMC 6817000. PMID 27709664. https://pubmed.ncbi.nlm.nih.gov/27709664.
- ↑ 16.0 16.1 Froom, Paul; Havis, Rosa; Barak, Mira (2009). "The rate of manual peripheral blood smear reviews in outpatients". Clinical Chemistry and Laboratory Medicine 47 (11): 1401–1405. doi:10.1515/CCLM.2009.308. ISSN 1437-4331. PMID 19778287. https://pubmed.ncbi.nlm.nih.gov/19778287.
- ↑ Palmer, L.; Briggs, C.; McFadden, S.; Zini, G.; Burthem, J.; Rozenberg, G.; Proytcheva, M.; Machin, S. J. (1 June 2015). "ICSH recommendations for the standardization of nomenclature and grading of peripheral blood cell morphological features". International Journal of Laboratory Hematology 37 (3): 287–303. doi:10.1111/ijlh.12327. ISSN 1751-553X. PMID 25728865. https://pubmed.ncbi.nlm.nih.gov/25728865.
- ↑ 18.0 18.1 Pratumvinit, Busadee; Wongkrajang, Preechaya; Reesukumal, Kanit; Klinbua, Cherdsak; Niamjoy, Patama (1 March 2013). "Validation and optimization of criteria for manual smear review following automated blood cell analysis in a large university hospital". Archives of Pathology & Laboratory Medicine 137 (3): 408–414. doi:10.5858/arpa.2011-0535-OA. ISSN 1543-2165. PMID 23451752. https://pubmed.ncbi.nlm.nih.gov/23451752.
- ↑ Barnes, P. W. (2005). "Comparison of performance characteristics between first- and third-generation hematology systems". Laboratory Hematology: Official Publication of the International Society for Laboratory Hematology 11 (4): 298–301. doi:10.1532/lh96.05037. ISSN 1080-2924. PMID 16475477. https://pubmed.ncbi.nlm.nih.gov/16475477.
- ↑ Barth, David (1 February 2012). "Approach to peripheral blood film assessment for pathologists". Seminars in Diagnostic Pathology 29 (1): 31–48. doi:10.1053/j.semdp.2011.07.003. ISSN 0740-2570. PMID 22372204. https://pubmed.ncbi.nlm.nih.gov/22372204.
- ↑ Rabizadeh, Esther; Pickholtz, Itay; Barak, Mira; Froom, Paul (1 August 2013). "Historical data decrease complete blood count reflex blood smear review rates without missing patients with acute leukaemia". Journal of Clinical Pathology 66 (8): 692–694. doi:10.1136/jclinpath-2012-201423. ISSN 1472-4146. PMID 23505267. https://pubmed.ncbi.nlm.nih.gov/23505267.
- ↑ Grieme, Caleb V.; Voss, Dena R.; Davis, Scott R.; Krasowski, Matthew D. (1 March 2017). "Impact of Endogenous and Exogenous Interferences on Clinical Chemistry Parameters Measured on Blood Gas Analyzers". Clinical Laboratory 63 (3): 561–568. doi:10.7754/Clin.Lab.2016.160932. ISSN 1433-6510. PMID 28271676. https://pubmed.ncbi.nlm.nih.gov/28271676.
- ↑ 23.0 23.1 Krasowski, Matthew D.; Wilford, Joseph D.; Howard, Wanita; Dane, Susan K.; Davis, Scott R.; Karandikar, Nitin J.; Blau, John L.; Ford, Bradley A. (2016). "Implementation of Epic Beaker Clinical Pathology at an academic medical center". Journal of Pathology Informatics 7: 7. doi:10.4103/2153-3539.175798. ISSN 2229-5089. PMC 4763507. PMID 26955505. https://pubmed.ncbi.nlm.nih.gov/26955505.
- ↑ 24.0 24.1 Tanaka, Yuzo; Tanaka, Yumiko; Gondo, Kazumi; Maruki, Yoshiko; Kondo, Tamiaki; Asai, Satomi; Matsushita, Hiromichi; Miyachi, Hayato (1 September 2014). "Performance evaluation of platelet counting by novel fluorescent dye staining in the XN-series automated hematology analyzers". Journal of Clinical Laboratory Analysis 28 (5): 341–348. doi:10.1002/jcla.21691. ISSN 1098-2825. PMC 6807536. PMID 24648166. https://pubmed.ncbi.nlm.nih.gov/24648166.
- ↑ Schoorl, Margreet; Schoorl, Marianne; Oomes, Jeanette; van Pelt, Johannes (1 October 2013). "New fluorescent method (PLT-F) on Sysmex XN2000 hematology analyzer achieved higher accuracy in low platelet counting". American Journal of Clinical Pathology 140 (4): 495–499. doi:10.1309/AJCPUAGGB4URL5XO. ISSN 1943-7722. PMID 24045545. https://pubmed.ncbi.nlm.nih.gov/24045545.
- ↑ Wada, Atsushi; Takagi, Yuri; Kono, Mari; Morikawa, Takashi (2015). "Accuracy of a New Platelet Count System (PLT-F) Depends on the Staining Property of Its Reagents". PloS One 10 (10): e0141311. doi:10.1371/journal.pone.0141311. ISSN 1932-6203. PMC 4619826. PMID 26496387. https://pubmed.ncbi.nlm.nih.gov/26496387.
Notes
This presentation is faithful to the original, with only a few minor changes to presentation, spelling, and grammar. In some cases important information was missing from the references, and that information was added. The original document mentions an "Additional File 1"; however, the original doesn't appear to include that file. The reference to Additional File 1 is maintained for this version, but contact the author to acquire the file.


