Journal:Process variation detection using missing data in a multihospital community practice anatomic pathology laboratory
| Full article title | Process variation detection using missing data in a multihospital community practice anatomic pathology laboratory |
|---|---|
| Journal | Journal of Pathology Informatics |
| Author(s) | Galliano, Gretchen E. |
| Author affiliation(s) | Ochsner Health System |
| Primary contact | Email: login at original journal required |
| Year published | 2019 |
| Volume and issue | 10 |
| Page(s) | 25 |
| DOI | 10.4103/jpi.jpi_18_19 |
| ISSN | 2153-3539 |
| Distribution license | Creative Commons Attribution-NonCommercial-ShareAlike 4.0 International |
| Website | http://www.jpathinformatics.org/ |
| Download | http://www.jpathinformatics.org/temp/JPatholInform10125-733533_202233.pdf (PDF) |
Abstract
Objectives: Barcode-driven workflows reduce patient identification errors. Missing process timestamp data frequently confound our health system's pending lists and appear as actions left undone. Anecdotally, it was noted that missing data could be found when there is procedure noncompliance. This project was developed to determine if missing timestamp data in the histology barcode-driven workflow correlated with other process variations, procedure noncompliance, or is an indicator of workflows needing focus for improvement projects.
Materials and methods: Data extracts of timestamp data from January 1, 2018 to December 15, 2018 for the major histology process steps were analyzed for missing data. Case-level analysis to determine the presence or absence of expected barcoding events was performed on 1031 surgical pathology cases to determine the cause of the missing data and determine if additional data variations or procedure noncompliance events were present. The data variations were classified according to a scheme defined in the study.
Results: Of 70,085 cases, there were 7,218 (10.3%) with missing process timestamp data. Missing histology process step data was associated with other additional data variations in case-level deep dives (P < 0.0001). Of the cases missing timestamp data in the initial review, 18.4% of the cases had no identifiable cause for the missing data (all expected events took place in the case-level deep dive).
Conclusions: Operationally, valuable information can be obtained by reviewing the types and causes of missing data in the anatomic pathology laboratory information system, but only in conjunction with user input and feedback.
Keywords: anatomic pathology laboratory information system, anatomic pathology, laboratory information systems, laboratory management
Background
Specimen identification errors in the laboratory, from collection to sign off, are estimated to occur in 0.6% to 6% of cases, depending on the definition of error and the test phase studied.[1][2][3][4] Layfield and Anderson found that incorrect linkage of a specimen to a patient can comprise up to 73% of in-process errors.[3] One way to combat this is through barcode-driven histology processes, which been shown to be safer and reduce specimen identification errors.[4] In fact, Zarbo et al. have shown that a barcode-enabled process can reduce laboratory misidentification errors by 62%.[4] There are several reasons for this, including a reduction in typing, a reduced need for interpretation of hand-written numbers, and improved maintenance of the chain of custody of all the assets of the case, from receipt to sign off, better ensuring the produced pathology materials correspond to the patient when procedures are followed fully. However, barcode-enabled processes are only as good as their integration into the workflows of the laboratory and use by the staff.[5][6]
Evaluation of workflows and processes in our anatomic pathology (AP) laboratory tend to be reactive or retrospective. The data points within an accessioned case or group of cases can be evaluated during root cause analyses (RCA) and may consume a significant amount of time, but that time is typically limited to the RCA and not necessarily routine or ongoing. Prospective evaluation and auditing of process variation and laboratory information system (LIS) integration into workflows may help identify performance improvement projects to enhance safety and identify areas that need focus.
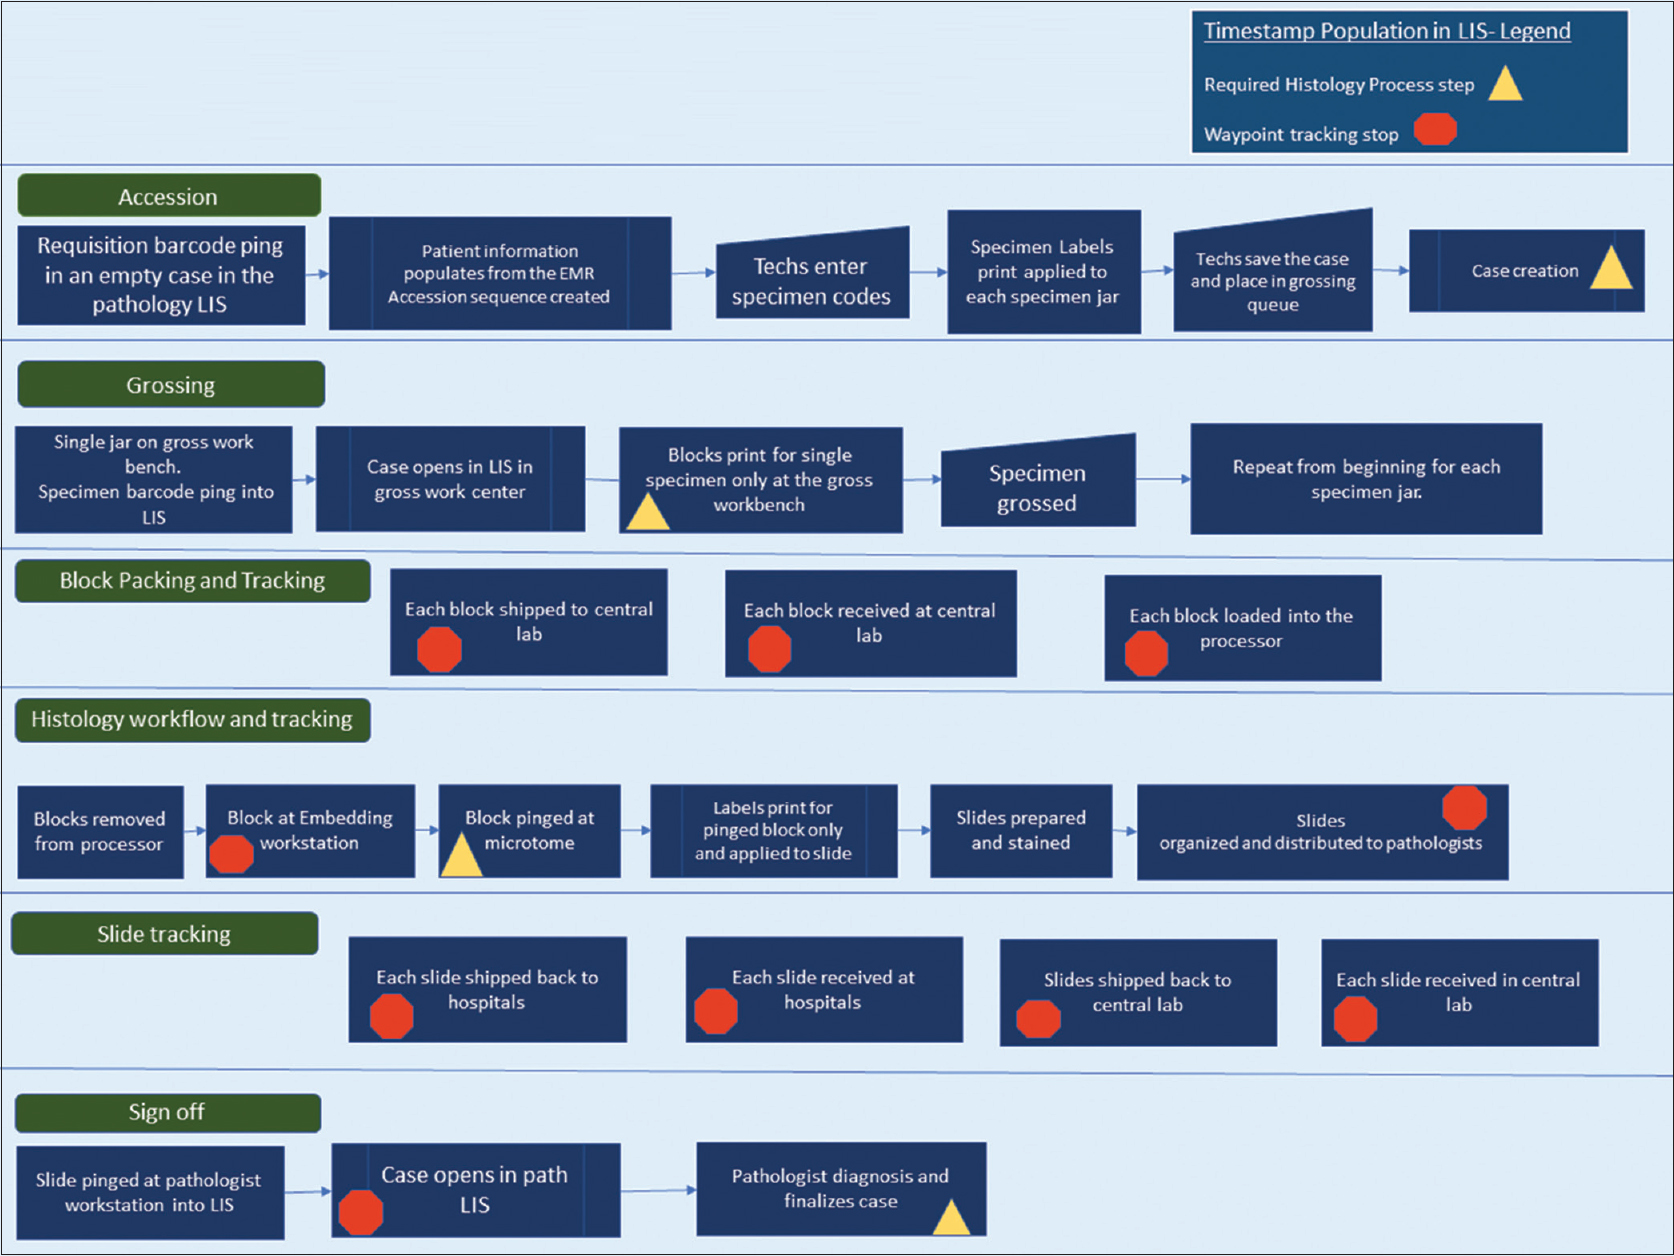
The individual pathology cases in our AP LIS contain two main types of timestamp data, each of which include date and time to the second. The first main type of timestamp data populates when a predefined workflow step or action is completed within the system. The case is then advanced to the next phase in the process in a pending state. As seen in Figure 1, the predefined process steps of the histology workflow include case creation (accession), grossing (gross worklist), histology preparation (slide creation after embedding), and case sign off (yellow triangles in Figure 1).
|
The second main type of timestamp data is tracking data (internally defined as "waypoints"). Waypoint data are recorded when a barcoding action is performed for grossing, processor loads, embedding, histology, and sign out. Additional timestamps are populated when blocks and slides are shipped at the point of origin and at the point of receipt (orange polygons in Figure 1). All specimen labels and pathology materials contain a two-dimensional (2D) barcode, and the types of materials that are barcoded include specimen jar labels after accessioning, blocks, and slides. Expected timestamps are included in the process map shown in Figure 1. Each timestamp can be viewed within each case or called in bulk through various management reports.
This project was developed to determine if evaluating cases with missing predefined process timestamps improved the ability to detect other data variations and procedure noncompliance in the AP workflow in a prospective fashion. This would potentially help identify workflows or facets of the laboratory information system that need focus for quality projects.
Materials and methods
Pathology information system raw timestamp data were extracted from the AP LIS (PathView Systems, Ltd. 2002–2019) for all surgical pathology cases in the Ochsner Health System from January 1, 2018 to December 15, 2018. The data table includes the following process, steps, and data points: accession number, collection date and time (inbound message from the electronic medical record), case creation date and time, grossing action timestamp, histology preparation timestamp (histology slide creation after embedding), and sign off. (See the Supplemental Material for an example of data table and case-level data). An additional waypoint timestamp is included in this raw data report, which marks the timestamp when histology has completed the case and is giving the case to the pathologist (slide distribution). The raw comma-separated value file data were analyzed for missing timestamp data (statistical programming language R in R studio [R version 3.5.1]) primarily using homebrew coding scripts to process and filter the data. The naniar package was used, which was developed to visualize missing data.[7][8] (See Additional File 1 in the Supplemental Material). Subsets were created by type of data missing, focusing on the following: (1) cases with missing gross plus histology plus slide distribution timestamps (“all three”), (2) cases with grossing action missing alone, (3) cases with histology action missing alone, and (4) cases with slide distribution waypoint missing alone. Random samples of cases with 100% populated timestamps for all process steps were selected as a comparison group from the database using the base R random sample function. Subsets with >400 cases with missing data were also sampled using the random sample function.
Detailed information of the individual cases within each subset was reviewed within the AP LIS to classify the reason the data was missing at the case level and look for additional data variations in other process steps in the waypoint tracking data. The case dive sought to determine the presence or absence of our expected barcode events and classify the identifiable causes for the missing data. Any additional data variations were also recorded.
The data variations were classified as follows:
- population error – no variation detected in any step, all procedures followed (the data failed to populate for an unknown reason)
- setup error – error associated with information system configuration
- Level 1 – minor process variation with minor risk potential
- Level 2 – missing data may indicate significant process variation or significant risk potential
- Level 3 – multiple missing data elements with multiple possible potential risk events
The population error classification was applied when a case-level deep dive showed all expected actions within the case and all procedures followed. The setup error classification was applied when the specimen setup file included process steps that are not routinely completed or needed for that specimen type, but the LIS build included those steps. An example of a setup error for our laboratory included gross-only cases that advance to a histology pending list even though there is no tissue to be placed on the processor.
Level 1 variations were applied to cases where there are minor procedure variations that lead to missing data. An example of a Level 1 variation includes extra unused blocks not deleted on the specimen, which leads to the case unnecessarily showing up on the histology pending list. Another Level 1 example is a missing slide distribution waypoint timestamp, which is not a critical process step but is used for tracking information and turnaround time calculations. A Level 2 variation was applied to cases where a timestamp was not recorded for an event and there could be a potential risk for not following that procedure. Level 2 variations include missing specimen ping data at the grossing station just before block print, missing block ping data at embedding, and missing slide ping for sign out. Level 2 errors could indicate typing and noncompliance with barcode-driven workflows. Level 3 variations include multiple Level 2 variations within one case. (Note that user ID information and personnel data were out-of-scope for this study.) This protocol was submitted and reviewed by the health system's Institutional Review Board.
Results
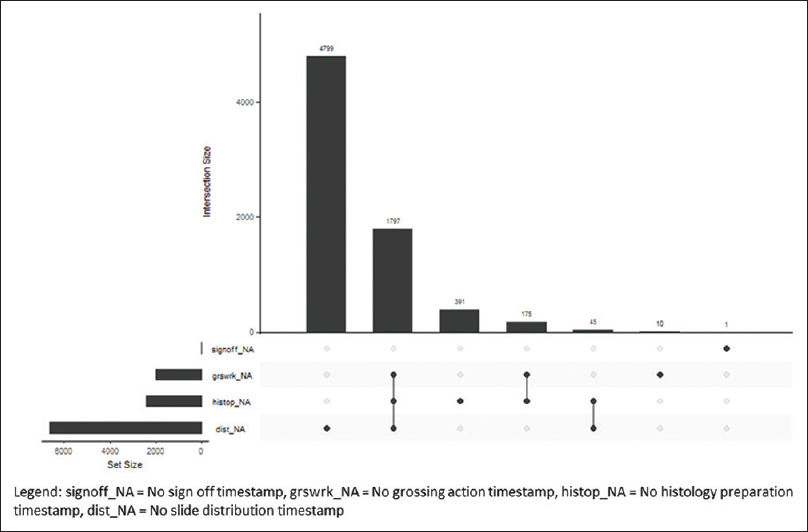
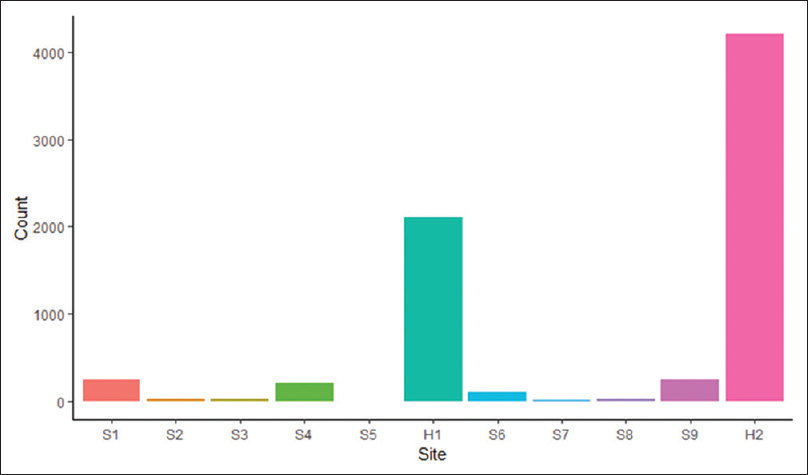
The Ochsner Health System has central histology processing with onsite grossing and accessioning, depending on the hospital size. The small hospitals and surgery centers in the health system ship accessioned specimens to the tertiary center for grossing, processing, and sign out. The midsize hospitals have on-site accessioning and grossing, and the blocks are sent to the central laboratory for processing and slide creation. There is one additional midsize hospital with an onsite AP laboratory with accessioning to processing and sign out. The timestamp data from 70,085 cases during the study period were extracted. The histology processes with missing timestamp data were classified by process step in an intersection plot (Figure 2) and classified by hospital site (Figure 3).
|
|
H1 is the central histology laboratory in the tertiary care hospital. H2 is a midsize hospital with an onsite histology laboratory. There was a total of 7,218 out of 70,085 (10.3%) cases missing timestamp data, of which 7,217 (99.9%) were eligible for a potential case-level deep dive because they were signed off at the time of the data pull. Cases from the larger subsets were randomly selected (details below). Two hundred additional random cases with complete timestamp data were included in the case-level analysis for a total of 1,031 individual case-level reviews. Descriptions of the findings by missing process steps are below.
Missing all three timestamps
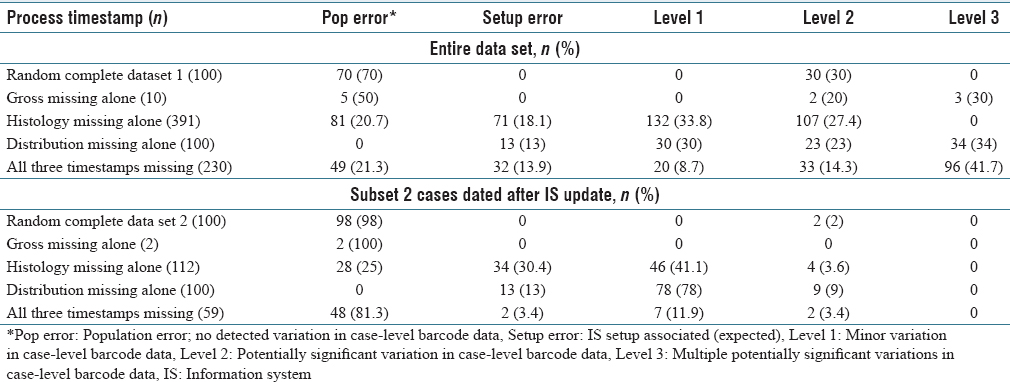
There were 1,797 of 70,085 (2.6%) signed-off cases with three timestamps missing, including grossing action, histology preparation, and slide distribution. The majority of cases were send-outs and gross-only cases as expected because of known setup errors. The cases with expected missing process steps were excluded for case-level analysis (gross-only, direct send-out cases, and outside slide reviews), and the remaining cases were explored for process variation classification (n = 230, 12.8% of 1,797). Forty-nine cases had population failure errors. Potentially significant Level 2 and Level 3 data variations were seen in 56.1% of cases missing three process step timestamps (n = 129). (See Table 1 for more.)
|
Missing grossing action timestamp alone
At the grossing workstations, the specimen label barcode for each specimen is pinged for block print, and the grossing action timestamp is populated. Ten cases were missing the grossing action timestamp alone out of 70,085 (0.01%). Potentially significant data variations were seen in 50% of the cases. Half of the cases had population errors.
Missing histology preparation timestamp alone
All tissue blocks have 2D barcodes. The histology process timestamp is populated when the block is pinged at the microtome for slide creation. There were 391 cases (0.56%) of missing histology preparation timestamp data alone out of 70,085. Potentially significant process data variation was seen in 27.4% of the cases missing the histology timestamp (see Table 1).
Missing slide distribution timestamp alone
After slides are stained and organized, the slide barcode is pinged at the slide distribution workstation just before handing off to the pathologist (as indicated in Figure 1). There were 4,799 cases missing the slide distribution timestamp alone out of 70,085 (6.8%). The missing timestamp data for slide distribution mainly occurred at the second histology laboratory H2. There is proximity of the histology laboratory to the pathologist and therefore less logistical burden and less need for the distribution barcode ping for that site. A random sample of 100 cases was extracted from the 4,799, using the random sampling algorithm in the base R statistical program. Out of the 100 random cases selected for deep dive, potentially significant Level 2 and Level 3 process data variation was detected in 57%. A second random sampling of 100 cases occurred for the period covered by subset 2 (described in more details below). Potentially significant data variation was seen in 9% of those cases.
Random case sample with completed timestamp data
A random sampling of 100 cases of the 70,085 with complete timestamp data was sampled using the base R random sample function. Out of 100 cases analyzed for data variations, 30% showed missing data classified as potentially significant. This was greater than expected given routine observations of procedure compliance at the workbenches.
An analysis into this greater than expected frequency of missing case-level data showed that the user information and workstation ID at each workstation were not uniformly populating the data tables for a period during 2018. A change was made in the pathology LIS in August 2018 to update the settings in the barcode setup file more frequently, to occur nightly. A second random case sampling of 100 cases for case-level data analysis was performed for the months after the nightly system updates went live. The second set of 100 random cases showed potentially significant data variations in 2% of cases.
The data variation classifications were combined into three groups: no variation, minor variation, and potentially significant data variations for statistical analysis. (See Table 2.) For the entire study period and period after the LIS updates (subset 2), missing timestamp data were significantly associated with process variation in both groups (Fisher's exact test, P < 0.001).
|
Conclusions
Both pathology and anatomic laboratories are operationally focused on known data, such as receipt to verify, analytical performance, pathology specimen turnaround times, and case volumes. The timestamp datasets are not routinely audited for missing data patterns in a prospective fashion in our laboratory. This study was developed to determine if investigating cases with missing data for the major predefined process steps in the histology workflow would increase the yield of finding other data variations or procedural noncompliance for education, or identify areas needing process improvement.
There were a variety of causes of missing data, including extra blocks left in the case during grossing, incorrect specimen code setup file associations, and routine workflow associated from the smaller histology laboratory. Minor data variations made up most of the missing data in the case-level analysis.
A greater than expected rate of barcode data variation was seen in the initial random sampling of cases with completely populated process timestamps. The LIS team found incomplete data population during the year because of inadequate protocols to update the barcode setup files. Health systems and hospital systems have multiple changes in users, computers, and workstation locations throughout the year. The user and data setup files need to adjust and update frequently to account for theses dynamic changes in the information system. An analysis on the subset of cases after the LIS was reconfigured to perform nightly updates (seen in Table 1, subset 2) was performed to determine if the missing data correlated with other case-level data variations after this change. The cases with missing process data were significantly associated with other data variations in all analyses (P < 0.001).
Clean data or completed data allow for full analysis of workflow and process steps. Complete data also allow for comparisons of observed versus expected events and real-time useable pending reports. In a multi-hospital health system with logistical complexity, a continuous check on work is needed for safe laboratory operations. However, when setting up an information system, balance is needed between two opposing states. One is allowing the case to proceed through the whole workflow occasionally without completing the prior expected process steps, though this may result in some missing data. The second state is setting up the system so that it is fully controlled with excessive hard stops but clean data. The purpose of this study was to evaluate if the cases with missing data in our workflow can help us select areas for optimization of the LIS and for evaluation of our best practices.
Sampling random cases with complete timestamp data were high yield for evaluating information system operational health because greater than expected missing barcode data were found in the initial case deep dive reviews. Sampling cases with missing data for process steps is high-yield for auditing data variations, with potential for procedure noncompliance (range 13%–100% rate of data variation detected). Our baseline potentially significant background case-level data variation with proper LIS configuration in this study was 2% for cases with completely populated process timestamp data and 5.5% for cases with missing process data, and these groups were found to be significantly different.
In this study, 18.4% had no explanation for the missing data in the case-level deep dives (see Table 1, population error). This finding was unexpected as there is no identifiable explanation, particularly since all procedures were followed. The information system failed to populate the correct expected information. This should be considered its own type of error, as these cases would show up on a pending list or operations lists as needing attention (i.e., potential wasted focus). Barcode failures did not seem to be the only cause as all expected barcode events were present in the case-level deep dives.
The AP LIS is vital for safe high-throughput processes in the AP laboratory. It may be intuitive to assume that non-compliant users are the cause of having potentially significant data variations in the above study. However, there was a high level of unexplained missing data, indicating that looking at data alone in the absence of a workflow evaluation or in the absence of user input does not produce a complete picture, as occasionally the LIS will also not perform as expected. In addition, in our rush production line type culture, people using the system can perform barcoding actions very quickly. Those timestamps may not populate the data tables as expected, especially for the bulk of barcoding events such as processor loads (observational). Periodically evaluating data patterns can give AP LIS teams and operations teams insight into user–LIS interactions and may help identify areas that need focus or updating. These evaluations are only meaningful when user input and feedback is obtained.
There were no operationally ready reports specifically focused on the missing data elements within our system. The use of the R statistical programming language, homebrew R coding scripts, and packages created specifically for missing data, as well as raw data extracts from the pathology AP LIS, allowed for visualization of the missing data and case selection for the deep dives.[7][8] (See Additional File 2 in the Supplementary Material for the coding scripts.)
Even though we did not collect user-specific data during the case-level deep dives, there did seem to be a prominent theme. New users in our system were seen more frequently in cases with data variations of all causes (observational). Now as a part of on boarding and competency evaluations, expected bar code pings will be included in case reviews for evaluations to provide feedback and revisit the “whys” of our procedures.
Supplementary material
The original article's URLs to the supplementary material are broken, and thus Additional File 1 and 2 are unavailable.
Acknowledgements
Thanks to all my teachers and mentors.
Financial support and sponsorship
Nil.
Conflicts of interest
There are no conflicts of interest.
References
- ↑ Nakhleh, R.E.; Zarbo, R.J. (1996). "Surgical pathology specimen identification and accessioning: A College of American Pathologists Q-Probes Study of 1,004,115 cases from 417 institutions". Archives of Pathology and Laboratory Medicine 120 (3): 227–33. PMID 8629896.
- ↑ Banks, P.; Brown, R.; Laslowski, A. et al. (2017). "A Proposed Set of Metrics to Reduce Patient Safety Risk From Within the Anatomic Pathology Laboratory". Laboratory Medicine 48 (2): 195–201. doi:10.1093/labmed/lmw068. PMC PMC5424539. PMID 28340232. https://www.ncbi.nlm.nih.gov/pmc/articles/PMC5424539.
- ↑ 3.0 3.1 Layfield, L.J.; Anderson, G.M. (2010). "Specimen labeling errors in surgical pathology: an 18-month experience". American Journal of Clinical Pathology 134 (3): 466-70. doi:10.1309/AJCPHLQHJ0S3DFJK. PMID 20716804.
- ↑ 4.0 4.1 4.2 Zarbo, R.J.; Tuthill, J.M.; D'Angelo, R. et al. (2009). "The Henry Ford Production System: reduction of surgical pathology in-process misidentification defects by bar code-specified work process standardization". American Journal of Clinical Pathology 131 (4): 468-77. doi:10.1309/AJCPPTJ3XJY6ZXDB. PMID 19289582.
- ↑ Nakhleh, R.E. (2009). "Core components of a comprehensive quality assurance program in anatomic pathology". Advances in Anatomic Pathology 16 (6): 418–23. doi:10.1097/PAP.0b013e3181bb6bf7. PMID 19851132.
- ↑ Hanna, M.G.; Pantanowitz, L. (2015). "Bar Coding and Tracking in Pathology". Surgical Pathology Clinics 8 (2): 123–35. doi:10.1016/j.path.2015.02.017. PMID 26065787.
- ↑ 7.0 7.1 "The R Project for Statistical Computing". The R Foundation. https://www.r-project.org/. Retrieved 30 March 2019.
- ↑ 8.0 8.1 Tierney, N.; Cook, D.; McBain, M. et al. (2019). "naniar". Credibly Curious. http://naniar.njtierney.com/.
Notes
This presentation is faithful to the original, with only a few minor changes to presentation. Grammar was cleaned up for smoother reading. In some cases important information was missing from the references, and that information was added. At the time of loading of this article, the links to the Additional File 1 and 2 were broken on the original site; a request to fix the errors has been sent to the journal.


