User:Shawndouglas/Sandbox
|
|
This is my sandbox, where I play with features and test MediaWiki code. If you wish to leave a comment for me, please see my discussion page instead. |
Sandbox begins below
| Full article title | Application of text analytics to extract and analyze material–application pairs from a large scientific corpus |
|---|---|
| Journal | Frontiers in Research Metrics and Analytics |
| Author(s) | Kalathil, Nikhil; Byrnes, John J.; Randazzese, Lucien; Hartnett, Daragh P.; Freyman, Christina A. |
| Author affiliation(s) | Center for Innovation Strategy and Policy and the Artificial Intelligence Center, SRI International |
| Primary contact | Email: christina dot freyman at sri dot com |
| Year published | 2018 |
| Volume and issue | 2 |
| Page(s) | 15 |
| DOI | 10.3389/frma.2017.00015 |
| ISSN | 2504-0537 |
| Distribution license | Creative Commons Attribution 4.0 International |
| Website | https://www.frontiersin.org/articles/10.3389/frma.2017.00015/full |
| Download | https://www.frontiersin.org/articles/10.3389/frma.2017.00015/pdf (PDF) |
|
|
This article should not be considered complete until this message box has been removed. This is a work in progress. |
Abstract
When assessing the importance of materials (or other components) to a given set of applications, machine analysis of a very large corpus of scientific abstracts can provide an analyst a base of insights to develop further. The use of text analytics reduces the time required to conduct an evaluation, while allowing analysts to experiment with a multitude of different hypotheses. Because the scope and quantity of metadata analyzed can, and should, be large, any divergence from what a human analyst determines and what the text analysis shows provides a prompt for the human analyst to reassess any preliminary findings. In this work, we have successfully extracted material–application pairs and ranked them on their importance. This method provides a novel way to map scientific advances in a particular material to the application for which it is used. Approximately 438,000 titles and abstracts of scientific papers published from 1992 to 2011 were used to examine 16 materials. This analysis used coclustering text analysis to associate individual materials with specific clean energy applications, evaluate the importance of materials to specific applications, and assess their importance to clean energy overall. Our analysis reproduced the judgments of experts in assigning material importance to applications. The validated methods were then used to map the replacement of one material with another material in a specific application (batteries).
Keywords: machine learning classification, science policy, coclustering, text analytics, critical materials, big data
Introduction
Scientific research and technological development are inherently combinatorial practices.[1] Researchers draw from, and build on, existing work in advancing the state of the art. Increasing the ability of researchers to review and understand previous research can stimulate and accelerate scientific progress. However, the number of scientific publications grows exponentially every year both on the aggregate level and in an individual field.[2] It is impossible for any single researcher or organization to keep up with the vastness of new scientific publications. The ability to use text analytics to map the current state of the art to detect progress would enable more efficient analyses of data.
The Intelligence Advanced Research Projects Activity recognized the scale problem in 2011, creating the research program Foresight and Understanding from Scientific Exposition. Under this program, SRI and other performers processed “the massive, multi-discipline, growing, noisy, and multilingual body of scientific and patent literature from around the world and automatically generated and prioritized technical terms within emerging technical areas, nominated those that exhibit technical emergence, and provided compelling evidence for the emergence.”[3] The work presented here applies and extends that platform to efficiently identify and describe the past and present evolution of research on a given set of materials. This work applies text analytics to demonstrate how these computational tools can be used by analysts to analyze much larger sets of data and develop more iterative and adaptive material assessments to better inform and shape government and industry research strategy and resource allocation.
Materials
Ground truth
The Department of Energy (DOE) has a specific interest in critical materials related to the energy economy. The DOE identifies critical materials through analysis of their use (demand) and supply. The approach balances an analysis of market dynamics (the vulnerability of materials to economic, geopolitical, and natural supply shocks) with technological analysis (the reliance of certain technologies on various materials). The DOE's R&D agenda is directly informed by assessments of material criticality. The DOE, the National Research Council, and the European Economic and Social Committee have all articulated a need for better measurements of material criticality. However, criticality depends on a multitude of different factors, including socioeconomic factors.[4] Various organizations across the world define resource criticality according to their own independent metrics and methodologies, and designations of criticality tend to vary dramatically.[4][5][6][7][8][9][10]
Experts tasked with assessing the role of materials must make decisions about what materials to focus on, what applications to review, what data sources to consult, and what analyses to pursue.[10] The amount of data available to assess is vast and far too large for any single analyst or organization to address comprehensively. In addition, to the best of our knowledge, previous assessments of material criticality have not involved a comprehensive review of scientific research on material use. [Graedel and colleagues have published extensively using raw data on supply and other indicators to measure criticality, see Graedel et al. (2012[11], 2015[10]) and Panousi et al. (2016[12]) and the references contained within.] Recent developments in text analytic computational approaches present a unique opportunity to develop new analytic approaches for assessing material criticality in a comprehensive, replicable, iterative manner.
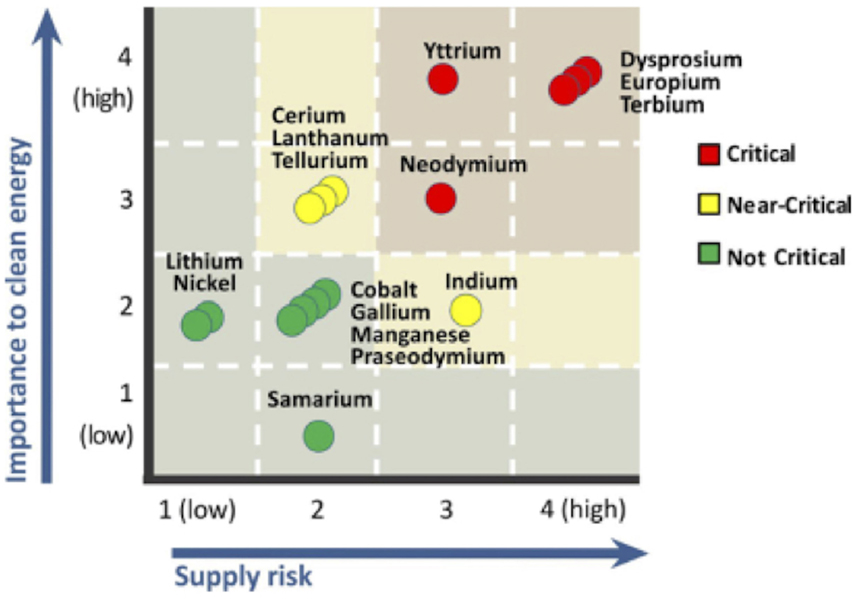
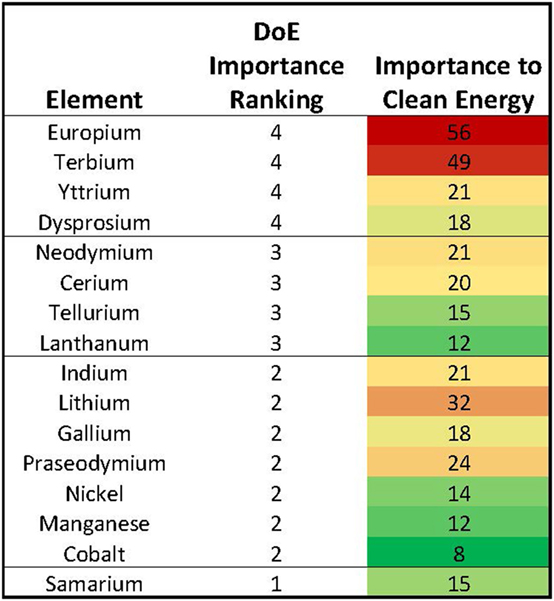
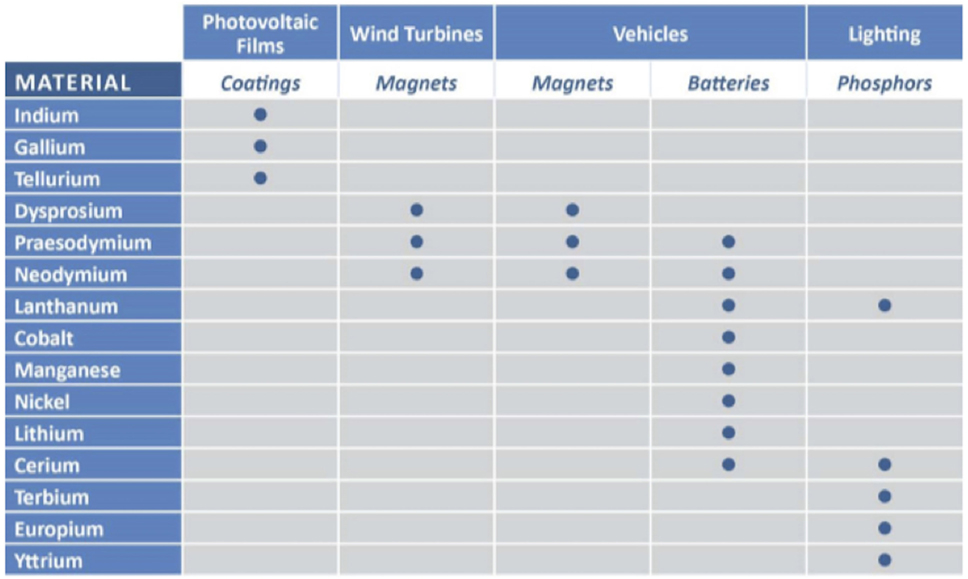
The Department of Energy’s 2011 Critical Materials Strategy (CMS) Report uses importance to clean energy as one dimension of the criticality matrix (see Figure 1).[13] In this regard, the DOE report serves as a form of ground truth for the validation of our technique, though the DOE report considered supply risk as the second dimension to criticality, which the analysis described in this paper does not address.
|
Scientific publications
Data on scientific research articles was obtained from the Web of Science (WoS) database available from Thomson Reuters (now Clarivate Analytics). WoS contains metadata records. In principle, we could have analyzed this entire database; however, for budget-related reasons, the document set was limited by a topic search of keywords that appear in a document title, abstract, author-provided keywords, and WoS-added keywords for the following:
- the 16 materials listed in the 2011 CMS, or
- the 285 unique alloys/composites of the 16 critical materials.
The document set was also limited to articles published between 1992 and 2011, the 20-year period leading up the DOE's most recent critical material assessment.
The 16 materials listed in the 2011 CMS include europium, terbium, yttrium, dysprosium, neodymium, cerium, tellurium, lanthanum, indium, lithium, gallium, praseodymium, nickel, manganese, cobalt, and samarium. Excluded from our documents set was any publication appearing in 80 fields considered not likely to cover research in scope (e.g., fields in the social sciences, biological sciences, etc.). We used the 16 materials listed above because we were interested in validating a methodology against the 2011 CMI Strategy report, and these are the materials mentioned therein. The resulting data set consisted of approximately 438,000 abstracts of scientific papers published from 1992 to 2011.
Methods
Text analytics and coclustering
The principle behind coclustering is the statistical analysis of the occurrences of terms in the text. This includes the processing of the relationships both between terms and neighboring (or nearby) terms, and between terms and the documents in which they occur. The approach presented here grouped papers by looking for sets of papers containing similar sets of terms. As detailed below, our analytic methods process meaning beyond simple counts of words, and thus, for example, put papers about earthquakes and papers about tremors in the same group, but would exclude papers in the medical space that discuss hand tremors.
Coclustering is based on an important technique in natural language processing which involves the embedding of terms into a real vector space; i.e., each word of the language is assigned a point in a high-dimensional space. Given a vector representation for a term, terms can be clustered using standard clustering techniques (also known as cluster analysis), such as hierarchical agglomeration, principle components analysis, K-means, and distribution mixture modeling.[14] This was first done in the 1980s under the name latent semantic analysis (LSA).[15] In the 1990s, neural networks were applied to find embeddings for terms using a technique called context vectors[16][17] A Bayesian analysis of context vectors in the late 1990s provided probabilistic interpretation and enabled applying information-theoretic techniques.[16][18] We refer to this technique as Association Grounded Semantics (AGS). A similar Bayesian analysis of LSA resulted in a technique referred to as probabilistic-LSA[19], which was later extended to a technique known as latent Dirichlet allocation (LDA).[20] LDA is commonly referred to as “topic modeling” and is probably the most widely applied technique for discovering groups of similar terms and similar documents. Much more recently, Google directly extended the context vector approach of the early 1990s to derive word embeddings using much greater computing power and much larger datasets than had been used in the past, resulting in the word2vec product, which is now widely known.[21][22]
The LDA model assumes that documents are collections of topics, and those topics generate terms, making it difficult to apply LDA to terms other than in the contexts of documents. Because coclustering treats the document as a context for a term, any other context of a term can be substituted in the coclustering model. For example, contexts may be neighboring terms or capital letters or punctuation. This allows us to apply coclustering to a much wider variety of feature types than is accommodated by LDA. In particular, “distributional clustering” (clustering of terms based on their distributions over nearby terms), which has been proven to be useful in information extraction[23][24] is captured by coclustering. In future work, we anticipate recognizing material names and application references using these techniques.
Word embeddings are primarily used to solve the “vocabulary problem” in natural language, which is that many ways exist to describe the same thing, so that a query for “earthquakes” will not necessarily pick up a report on a “tremor” unless some generalization can be provided to produce soft matching. The embeddings produce exactly such a mapping. Applying the information-theoretic approach called AGS led to the development of coclustering[25], one of the key text analytic tools used in this research.
Information-theoretic coclustering is the simultaneous estimation of two partitions (a mutually exclusive, collectively exhaustive collection of sets) of values of two categorical variable (such as “term” and “document”). Each member of the partition is referred to as a cluster. Formally, if X ranges over terms x0, x1, …, Y ranges over documents y0, y1, …, and Pr(X = x, Y = y) is the probability of selecting an occurrence of term x in document y given that an arbitrary term occurrence is selected from a document corpus, then the mutual information I(X;Y) between X and Y is given by:
We seek a partition A = {a0, a1, …} over X and a partition B = {b0, b1, …} over Y such that I(A;B) is as high as possible. Since the information in the A, B co-occurrence matrix is derived from the information in the X, Y co-occurrence matrix, maximizing I(A;B) is the same as minimizing I(X;Y) − I(A;B), we are compressing the original data (by replacing terms with term clusters and documents with document clusters) and minimizing the information lost due to compression.
Compound terms were discovered from the data through a common technique[26] in which sequences are considered to be compound terms if the frequency of the sequence is significantly greater than that predicted from the frequency of the individual terms under the assumption that their occurrences are independent. As an example, when reading an American newspaper, the term “York” occurs considerably more frequently after the term “New” than it occurs in the newspaper overall, leading to the conclusion that “New York” should be treated as a single compound term. We formalize this as follows. Let Pr(Xi = x0) be the probability that the term occurring at an arbitrarily selected position Xi in the corpus is the term x0. Then, Pr(Xi = x0, Xi+1 = x1) is the probability of the event that x0 is seen immediately followed by x1. If x0 and x1 occur independently of each other, then we would predict Pr(Xi = x0, Xi+1 = x1) = Pr(Xi = x0)Pr(Xi+1 = x1). To measure the amount that the occurrences do seem to depend on each other, we measure the ratio:
As this ratio becomes significantly higher than one, we become more confident that the sequence of terms should be treated as a single unit. This technique was iterated to provide for the construction of longer compound terms, such as “superconducting quantum interference device magnetometer.” The compound terms that either start or end with a word from a fixed list of prepositions and determiners (commonly referred to as “stopwords”) were deleted, in order to avoid having sequences such as “of platinum” become terms. This technique removes any reliance on domain-specific dictionaries or word lists, other than the list of prepositions and determiners.
Coclustering algorithms (detailed above) produce clusters of similar terms based on the titles and abstracts in which they appear, while grouping similar documents based on the terms they contain: thus, the name cocluster. In this project, a "document" is defined as a combined title and abstract. The process can be thought of as analogous to solving two equations with two unknowns. The process partitions the data into a set of collectively exhaustive document and term clusters resulting in term clusters that are maximally predictive of document clusters and document clusters that are maximally predictive of term clusters.
Coclustering results can be portrayed as an M × N matrix of term clusters (defined by the terms they contain) and document clusters (defined by the documents they contain). Terms that appear frequently in similar sets of documents are grouped together, while documents that mention similar terms are grouped together. Each term will appear in one, and only one, term cluster, while each document will appear in one, and only one, document cluster. When deciding on how many clusters to start with (term or document, i.e., M and N) there is a tradeoff between breadth and depth. The goal is to differentiate between sub-topics while including a reasonable range of technical discussion within a single topic. The balance between breadth and depth is reflected in the number of clusters that are created. Partitioning into a larger number of clusters would result in more narrowly defined initial clusters, but might mischaracterize topics that span multiple clusters. On the other hand, partitioning into fewer clusters would capture broader topics. Researchers interested in a more fine-grained understanding of materials use, e.g., interested in isolating a set of documents focused on a narrower scientific or technological topic, would need to sub-cluster these initial broad clusters in later analyses.
Terms in term clusters, and titles and abstracts (i.e., document data) from document clusters reveal the content of each cluster. This information provides the basis for identifying what each term cluster “is about” and for selecting term clusters for further scrutiny. Term clusters of interest were filtered using a glossary, in this case, terms pertaining to common applications of the 16 critical materials. This list of terms was manually created through a brief literature review of common applications associated with the materials in question.
Each term cluster was correlated with each of the 437,978 scientific abstracts in our corpus, and the degree of similarity was determined between each term cluster and each abstract through an assessment of their mutual information. As discussed, the term clusters and document clusters described above were selected so as to maximize the mutual information between terms. In order to find document abstracts most strongly associated with a given term cluster, we want to choose those abstracts which were most predictive of the term cluster. These are the abstracts that contain the words in the cluster, but especially the words in the cluster that are rare in the corpus in general. We formalize this by defining the association of a term cluster t and document abstract d as the value of the (t,d)-term of the mutual information formula.
To formalize this, we consider uniformly randomly selecting an arbitrary term occurrence from the entire document set, and we write Pr(T = t, D = d) for the probability that the term was a member of cluster t and that the occurrence was in document d. We adopt the maximum likelihood estimate for this probability:
where n(t,d) is the number of occurrences of terms from term cluster t in document abstract d and N is the total of number of term occurrences in all documents: N = ∑t,dn(t,d).
We define the association between t and d by the score:
Given this score, document abstracts can be arranged from most associated to least associated with a given term cluster. This was done for all 437,978 abstracts in our corpus and all term clusters. This methodology allowed the identification of those abstracts most closely associated with each term cluster.
Not all disperse term clusters were easy to interpret. As with the construction of an appropriate filtering glossary, deciding on the appropriate number of sub-clusters can be subjective. In general, the more diffuse a term cluster appears to be in its subject matter, the more it should be sub-clustered as a means to separate its diverse topic matter. Even imprecise sub-clustering is effective in narrowing the focus of these clusters. Once we determined the number of sub-clusters to generate, sub-clustering of terms was done in the same general manner as the original coclustering: the same coclustering algorithms were applied only to the terms in the initial cluster, but it is instructed not to discover any new abstract clusters. Rather, the set of terms in a cluster are grouped into the pre-specified number of bins according to similarity in the already existing groups of documents in which the terms appear.
Results
Workflow
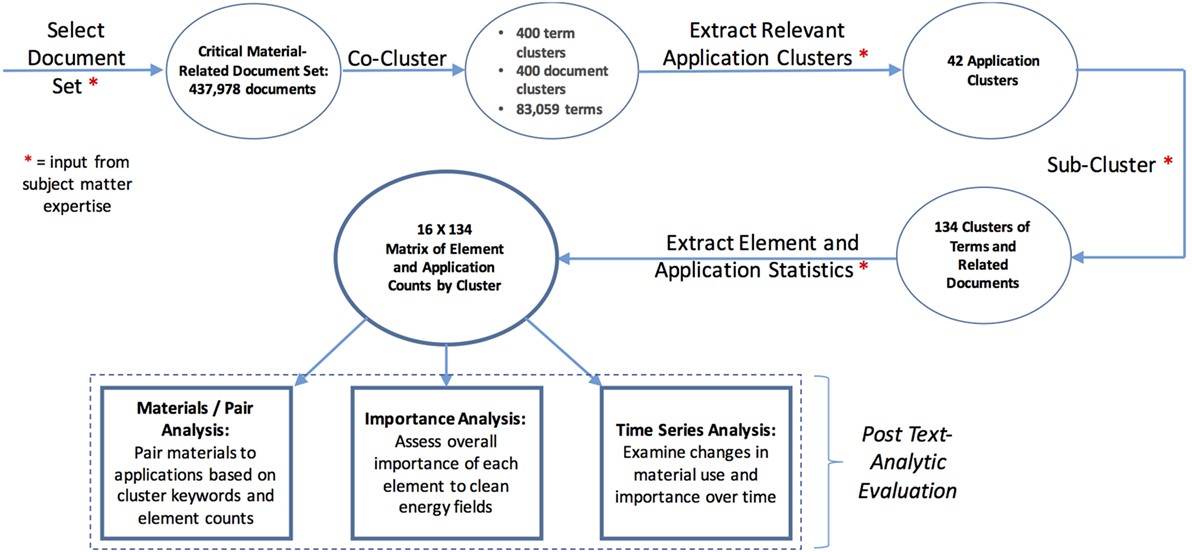
This research resulted in the creation of the following workflow, detailed in Figure 2. The workflow was developed to assess the material–application pairing matrices, and it illustrates how text analytics can be used to aid in assessment of material importance to specific application areas, identify pairings of materials and applications, and augment a human expert’s ability to monitor the use and importance of materials.
|
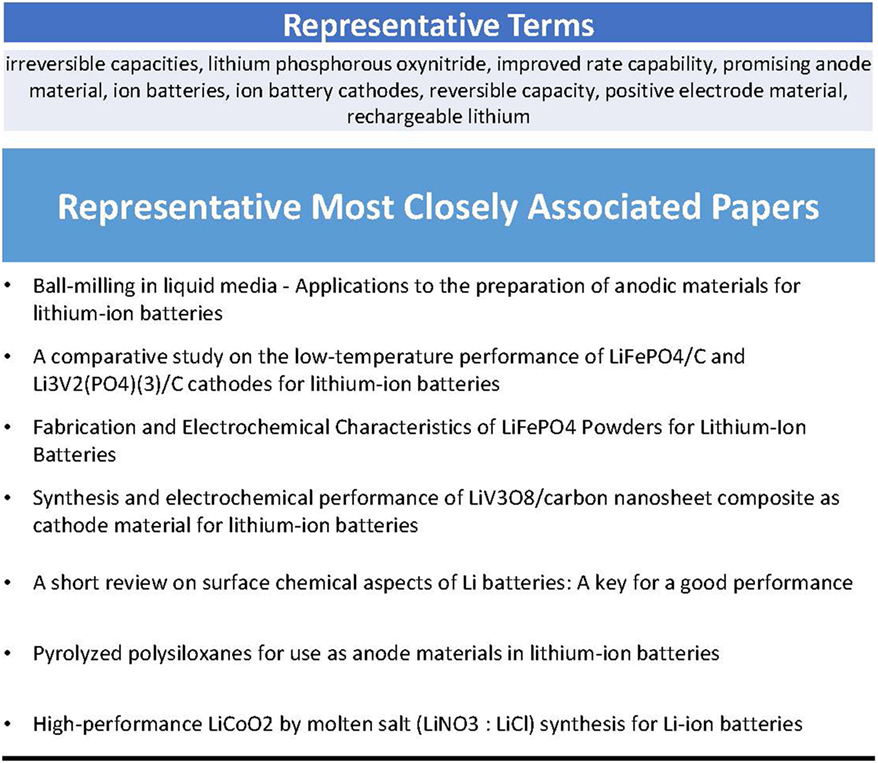
The final data set acquired and ingested into the Copernicus platform contained 437,978 documents. We extracted 83,059 terms from titles and abstracts, including compound (multi-part) terms such as “chloroplatinic acid” and “alluvial platinum.” Initial clustering of terms showed some term clusters were very precise, others were less focused. Multiple clustering sizes were experimented with to find an optimal size, which was 400 document clusters and 400 term clusters to start, creating a 400 × 400 matrix of document and term clusters. By manually analyzing the terms in each term cluster, we identified which clusters focused narrowly on areas most relevant to our study, namely those that use materials in clean energy applications. The term cluster in Figure 3 below, for example, focused around lithium-ion batteries, as indicated by the representative term list and an analysis of the most closely associated papers.
|
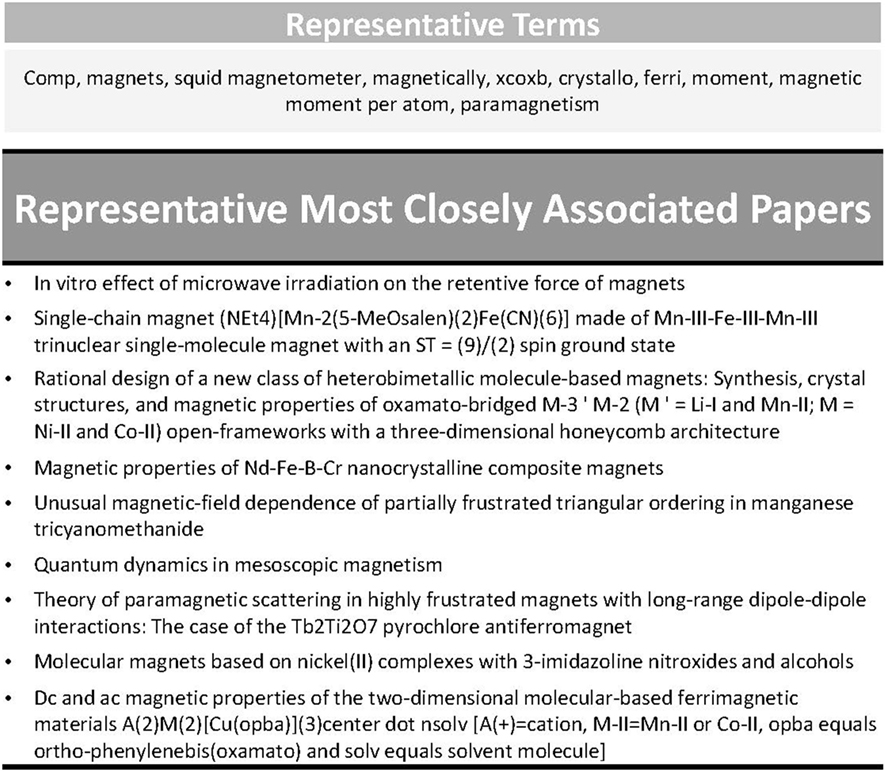
Analysis relies on our ability to extract meaningful statistics about the dataset from term clusters, which can be poorly defined, as seen in the example term cluster in Figure 4. When term clusters are poorly defined, we have limited ability to interpret the statistics we extract. There are multiple ways to differentiate term clusters. Principal among these was the division between term clusters that cover basic scientific research versus those that focused on specific technological applications. In addition, because this project used the 2011 DOE CMS as a validation source, a differentiation between clean energy and non-clean energy relevance was also necessary, especially when the same material discoveries were used in both a clean energy and non-clean energy context. More broadly, if a researcher is interested in a specific application area, a division between that application area and others can be used as the means for differentiation.
|
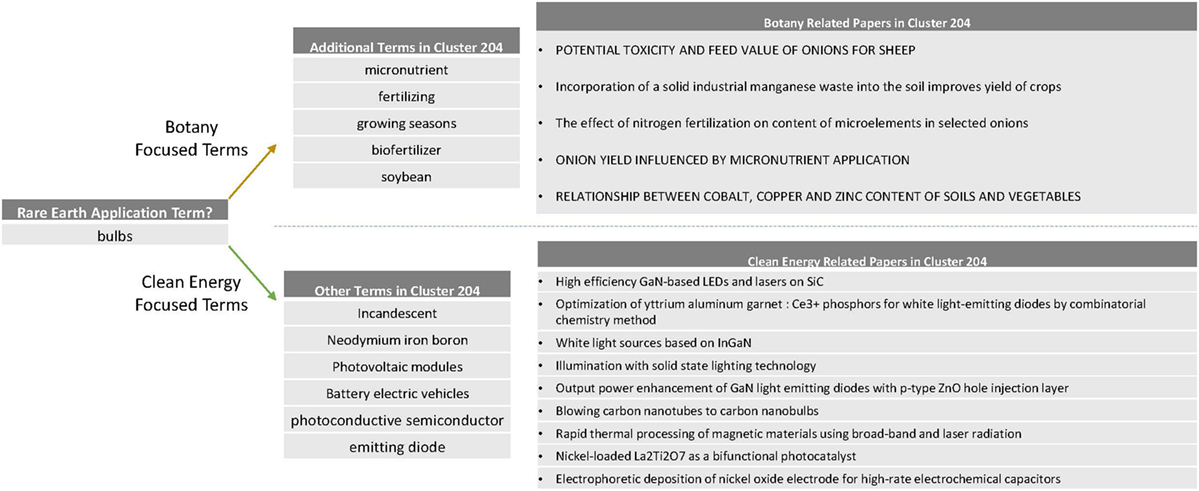
As discussed in the “Methods” section for this project, we manually determined the number of necessary sub-clusters. For example, one of the glossary terms we used was “bulbs.” A term cluster was identified as the bulb cluster. Once it was examined closely, however, it was clear it contained material about both plant bulbs as well as light bulbs, as shown in Figure 5. Accordingly, it was clear that this cluster should be split (sub-clustered) into two clusters. After sub-clustering, the term cluster split into two clearly defined clusters.
|
The process of sub-clustering expanded the list of initial 42 application term clusters into a total of 134 relevant term clusters for analysis. Clusters were considered “relevant” based on the weights that were assigned to them. For this project, we developed a methodology for weighting clusters to replicate the ground truth of the 2011 DOE CMS.
Weighting
One of the principal questions addressed by the 2011 DOE CMS was the importance of specific materials to clean energy applications. The DOE ranked the 16 materials based on their importance to clean energy, and their supply risk, as detailed in Figure 1. We developed a methodology to replicate the y-axis of this figure (material importance to clean energy) by combining the data on material distribution over clusters with an assessment of the clean energy importance of each cluster. To assess the clean energy importance of each of these clusters, we developed a clean energy importance weighting. A set of key words was constructed manually and searched the top 500 associated abstracts of each term cluster for these key words. Constructing this glossary is a crucial step that allows researchers to define their key words of interest. Document abstracts were analyzed for mentions of any clean energy field per cluster, and the number of different clean energy fields mentioned across the cluster. The clean energy weighting considers the extent and depth of impact within a cluster, and is equal to:
This weighting essentially captures the number of abstracts per clean energy field. The goal of the weighting is to discount clusters that mention a number of different clean energy fields, but do not discuss these clean energy fields in a substantial or significant manner. Materials that were mentioned frequently in clusters with high clean energy weights can be thought of as “important” to clean energy. The importance of each material to clean energy was determined by counting the number of document mentions in clean energy important clusters (i.e., clusters above some cutoff of minimum clean energy weight).
Material-to-clean-energy field application pairings were derived from term clusters. Recall that for each term cluster, the number of abstracts mentioning any of the 16 materials were determined as well as the number of abstracts mentioning any of 33 clean energy field keywords. In the importance analysis previously discussed, mentions of 33 clean energy fields were aggregated together to establish the clean energy weighting system. For each clean energy field, all term clusters were ranked based on a normalized count of document mentions of that field.
From this ranking, the “top” three term clusters were identified for a specific field for review. Then, the terms and keywords were manually reviewed to ensure that term clusters were actually relevant and the occasional false positives (term clusters that score high based on keyword counts but are not in fact relevant based on human content analysis) were discarded. This manual review, while requiring human intervention, is done on a significantly narrowed set of documents, and thus does not represent a major bottleneck in the process. Having linked clusters to a specific clean energy field, material importance to each field was evaluated by examining the distribution of material mentions across associated documents. The number of mentions divided by the average mentions across all 134 relevant term clusters was used to account for keywords or phrases that were mentioned at a high frequency. In the photovoltaics case, these normalized number of mentions dropped significantly after the first three term clusters. The first three term clusters were manually reviewed to ensure that they were relevant.
Extracting statistics
Statistics related to material importance and material–application pairings were extracted from this final set of 134 relevant term clusters. For the purpose of this project, the top 500 abstracts from each of the 134 final clusters were analyzed, for a resulting 49,573 abstracts. Each of these 500 abstracts were automatically searched for mentions of the 16 materials (these counts included any compounds or alloys associated with those minerals) identified in the DOE strategy report, providing a count and distribution of material counts across the final set of granular term clusters that will serve as the basis for a subsequent manual analysis. An alternative to coclustering is hierarchical clustering in which terms are joined with their nearest matches only, and then each cluster is joined with its nearest match only, etc. Such an approach makes sub-clustering trivial by reducing it to undoing the merges that generated a given cluster. We opted against this structure because in past experience hierarchical clusters have generated qualitatively inferior clusterings of terms.
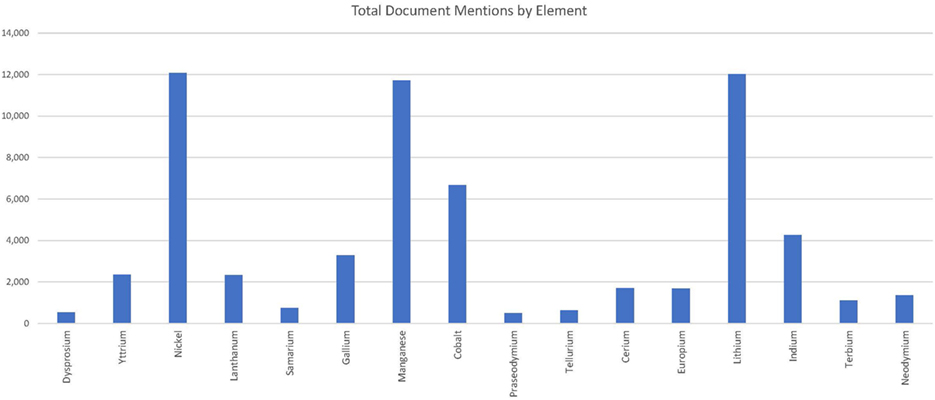
Figure 6 displays the count of how many times each material was mentioned in the 49,573 abstracts that had the highest mutual information with the final 134 relevant term clusters (the 500 abstracts with the most mutual information with each of the 134 relevant term clusters). Material mentions were counted in the papers most closely associated with each term. This revealed what materials were most strongly associated with which terms. Thus, the methodology provides a way to analyze the distribution of materials over different topics, setting the foundation for material importance and material–application pair analysis.
|
Validation of method
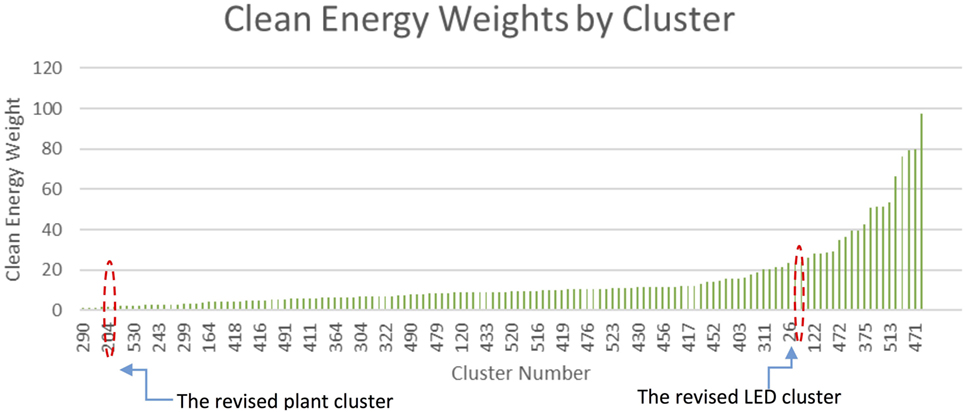
To compare the results with the CMS, we need to weight for clean energy, as described above. Multiple clean energy cutoffs were reviewed and ultimately a cutoff of 26 was employed. The cutoff of 26 corresponds to the beginning of the step up in the distribution presented in Figure 7. Thus, term clusters with a clean energy weight of less than 26 were excluded.
|
Material mentions over the top 500 abstracts associated with the 19 “clean energy” term clusters were aggregated together, yielding a measure of overall importance to clean energy, as seen in Figure 8. This measure of overall importance counted the number of times each material was mentioned in the top 500 abstracts associated with the 19 term clusters that are highly important to clean energy, treating those term clusters as one set. The top and the bottom of our determination of importance matched the top and bottom of the DOE’s list. However, there was some variation in the middle. Such variation, in the case of real-world analysis, would provide analyst prompts regarding where to consider more study, and whether some aspects of a materials clean energy use and importance.
|
Material-application pairings
SRI utilized the term and document clusters to develop a matrix of material–application pairs to compare the ground truth. This was compared to the DOE 2011 CMS matrix that mapped materials to specific clean energy technologies (see Figure 9). The prevalence of different materials to a given clean energy field was considered, as defined and described above.
|
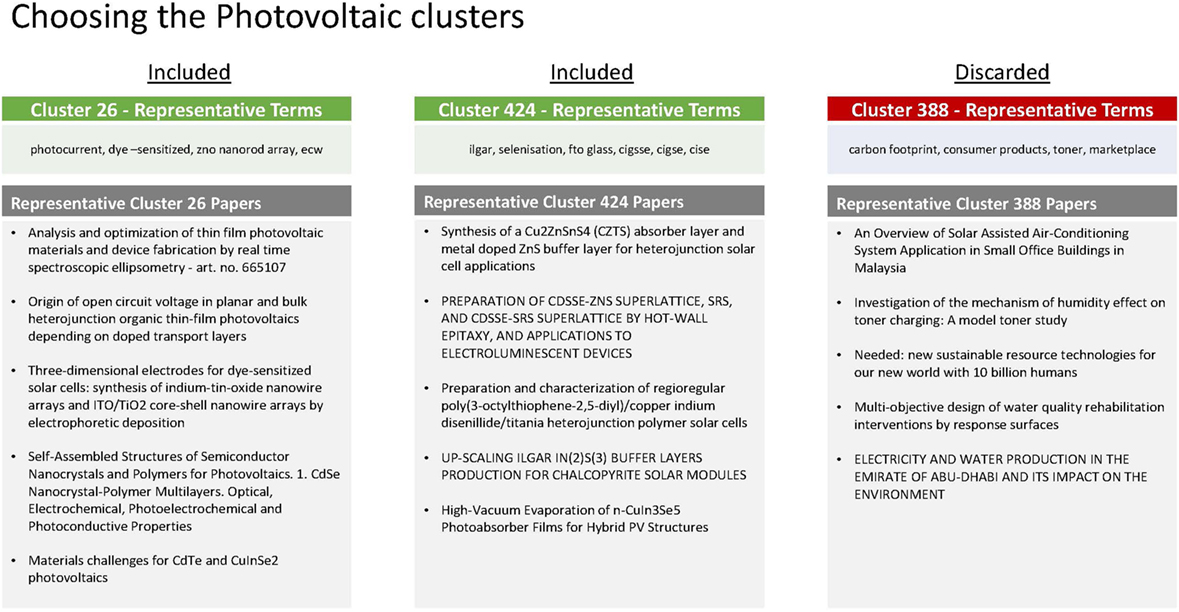
Figure 10 displays three term clusters, as illustration of the results and filtering step. The term cluster labeled 388 discussed the economic implications of photovoltaic technologies, and so was discarded after manual review. The other two clusters can be used to measure the distribution of material mentions across the associated abstracts of the top term clusters, an indicator of material importance to that specific application.
|
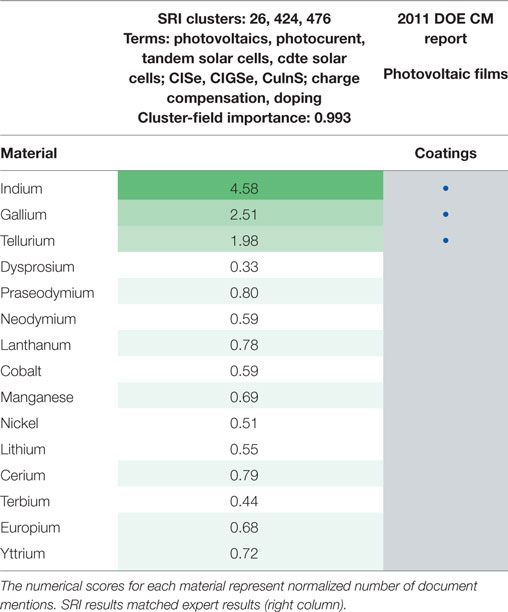
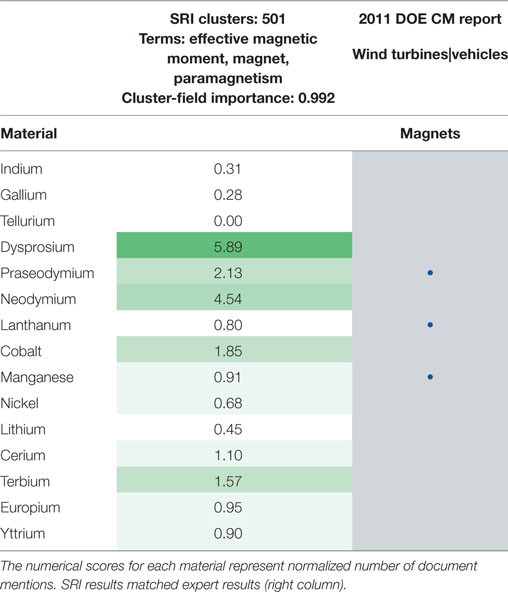
Each material was scored based on a normalized number of mentions across abstracts associated with each of the term clusters of analysis. In this case, the results from our methodology mirror the results from the DOE’s report exactly: indium, gallium, and tellurium are considered the most important materials to photovoltaics (see Table 1). Similarly, the results for magnets mirrored the DOE’s results (see Table 2).
|
|
References
- ↑ Arthur, W.B. (2009). The Nature of Technology: What It Is and How It Evolves. Simon and Schuster. p. 256. ISBN 9781439165782.
- ↑ National Science Board (11 January 2016). "Science and Engineering Indicators 2016" (PDF). National Science Foundation. pp. 899. https://www.nsf.gov/statistics/2016/nsb20161/uploads/1/nsb20161.pdf.
- ↑ "IARPA Launches New Program to Enable the Rapid Discovery of Emerging Technical Capabilities". Office of the Director of National Intelligence. 27 September 2011. https://www.dni.gov/index.php/newsroom/press-releases/press-releases-2011/item/327-iarpa-launches-new-program-to-enable-the-rapid-discovery-of-emerging-technical-capabilities.
- ↑ 4.0 4.1 Poulton, M.M.; Jagers, S.C.; Linde, S. et al. (2013). "State of the World's Nonfuel Mineral Resources: Supply, Demand, and Socio-Institutional Fundamentals". Annual Review of Environment and Resources 38: 345–371. doi:10.1146/annurev-environ-022310-094734.
- ↑ Committee on Critical Mineral Impacts on the U.S. Economy (2008). Minerals, Critical Minerals, and the U.S. Economy. National Academies Press. pp. 262. doi:10.17226/12034. ISBN 9780309112826. https://www.nap.edu/catalog/12034/minerals-critical-minerals-and-the-us-economy.
- ↑ Committee on Assessing the Need for a Defense Stockpile (2008). Managing Materials for a Twenty-first Century Military. National Academies Press. pp. 206. doi:10.17226/12028. ISBN 9780309177924. https://www.nap.edu/catalog/12028/managing-materials-for-a-twenty-first-century-military.
- ↑ Erdmann, L.; Graedel, T.E. (2011). "Criticality of non-fuel minerals: A review of major approaches and analyses". Environmental Science and Technology 45 (18): 7620–30. doi:10.1021/es200563g. PMID 21834560.
- ↑ "Communication from the Commission to the European Parliament, the Council, the European Economic and Social Committee and the Committee of the Regions Tackling the Challenges in Commodity Markets and on Raw Materials". Eur-Lex. European Union. 2 February 2011. https://eur-lex.europa.eu/legal-content/EN/TXT/?uri=celex%3A52011DC0025.
- ↑ "Report on Critical Raw Materials for the E.U.: Report of the Ad hoc Working Group on defining critical raw materials" (PDF). European Commission. May 2014. pp. 41. https://ec.europa.eu/docsroom/documents/10010/attachments/1/translations/en/renditions/pdf.
- ↑ 10.0 10.1 10.2 Graedel, T.E.; Harper, E.M.; Nassar, N.T. et al. (2015). "Criticality of metals and metalloids". Proceedings of the National Academy of Sciences of the United States of America 112 (14): 4257-62. doi:10.1073/pnas.1500415112. PMC PMC4394315. PMID 25831527. https://www.ncbi.nlm.nih.gov/pmc/articles/PMC4394315.
- ↑ Graedel, T.E.; Barr, R.; Chandler, C. et al. (2012). "Methodology of metal criticality determination". Environmental Science and Technology 46 (2): 1063–70. doi:10.1021/es203534z. PMID 22191617.
- ↑ Panousi, S.; Harper, E.M.; Nuss, P. et al. (2016). "Criticality of Seven Specialty Metals". Journal of Industrial Ecology 20 (4): 837-853. doi:10.1111/jiec.12295.
- ↑ Office of Policy and International Affairs (December 2011). "Critical Materials Strategy" (PDF). U.S. Department of Energy. https://www.energy.gov/sites/prod/files/DOE_CMS2011_FINAL_Full.pdf.
- ↑ Hastie, T.; Tibshirani, R.; Friedman, J. (2009). The Elements of Statistical Learning. Springer. pp. 745. ISBN 9780387848570.
- ↑ Furnas, G.W.; Landauer, T.K.; Gomez, L.M.; Dumais, S.T. (1987). "The vocabulary problem in human-system communication". Communications of the ACM 30 (11): 964–971. doi:10.1145/32206.32212.
- ↑ 16.0 16.1 Gallant, S.I.; Caid, W.R.; Carleton, J. et al. (1992). "HNC's MatchPlus system". ACM SIGIR Forum 26 (2): 34–38. doi:10.1145/146565.146569.
- ↑ Caid, W.R.; Dumais, S.T.; Gallant, S.I. et al. (1995). "Learned vector-space models for document retrieval". Information Processing and Management 31 (3): 419–429. doi:10.1016/0306-4573(94)00056-9.
- ↑ Zhu, H.; Rohwer, R. (1995). "Bayesian invariant measurements of generalization". Neural Processing Letters 2 (6): 28–31. doi:10.1007/BF02309013.
- ↑ Hofmann, T. (1999). "Probabilistic latent semantic indexing". Proceedings of the 22nd Annual International ACM SIGIR Conference on Research and Development in Information Retrieval: 50–57. doi:10.1145/312624.312649.
- ↑ Blei, D.M.; Ng, A.Y.; Jordan, M.I. (2003). "Latent Dirichlet Allocation". Journal of Machine Learning Research 3 (1): 993–1022. http://www.jmlr.org/papers/v3/blei03a.html.
- ↑ Mikolov, T.; Chen, K.; Corrado, G.; Dean, J. (7 September 2013). "Efficient Estimation of Word Representations in Vector Space". Cornell University Library. https://arxiv.org/abs/1301.3781.
- ↑ Bellemare, M.G.; Naddaf, Y.; Veness, J.; Bowling, M. (2015). "The arcade learning environment: An evaluation platform for general agents". Proceedings of the 24th International Conference on Artificial Intelligence: 4148–4152.
- ↑ Freitag, D. (2004). "Toward unsupervised whole-corpus tagging". Proceedings of the 20th International Conference on Computational Linguistics: 357. doi:10.3115/1220355.1220407.
- ↑ Freitag, D. (2004). "Trained Named Entity Recognition using Distributional Clusters". Proceedings of the 2004 Conference on Empirical Methods in Natural Language Processing: 262–69. http://www.aclweb.org/anthology/W04-3234.
- ↑ Byrnes, J.; Rohwer, R. (2005). "Text Modeling for Real-Time Document Categorization". Proceedings of the 2005 IEEE Aerospace Conference. doi:10.1109/AERO.2005.1559610.
- ↑ Manning, C.D.; Schütze, H. (1999). Foundations of Statistical Natural Language Processing. The MIT Press. p. 620. ISBN 9780262133609.
Notes
This presentation is faithful to the original, with only a few minor changes to presentation. In some cases important information was missing from the references, and that information was added. The original article lists references alphabetically, but this version — by design — lists them in order of appearance. Turned the singular footnote from the original article into inline text in parentheses for this version.
