LII:Notes on Instrument Data Systems
Title: Notes on Instrument Data Systems
Author for citation: Joe Liscouski, with editorial modifications by Shawn Douglas
License for content: Creative Commons Attribution 4.0 International
Publication date: May 27, 2020
Introduction
The goal of this brief paper is to examine what it will take to advance laboratory operations in terms of technical content, data quality, and productivity. Advancements in the past have been incremental, and isolated, the result of an individual's or group's work and not part of a broad industry plan. Disjointed, uncoordinated, incremental improvements have to give way to planned, directed methods, such that appropriate standards and products can be developed and mutually beneficial R&D programs instituted. We’ve long since entered a phase where the cost of technology development and implementation is too high to rely on a “let’s try this” approach as the dominant methodology. Making progress in lab technologies is too important to be done without some direction (i.e., deliberate planning). Individual insights, inspiration, and “out of the box” thinking is always valuable; it can inspire a change in direction. But building to a purpose is equally important. This paper revisits past developments in instrument data systems (IDS), looks at issues that need attention as we further venture into the use of integrated informatics systems, and suggests some directions further development can take.
There is a second aspect beyond planning that also deserves attention: education. Yes, there are people who really know what they are doing with instrumental systems and data handling. However, that knowledge base isn’t universal across labs. Many industrial labs and schools have people using instrument data systems with no understanding of what is happening to their data. Others such as Hinshaw and Stevenson et al. have commented on this phenomenon in the past:
Chromatographers go to great lengths to prepare, inject, and separate their samples, but they sometimes do not pay as much attention to the next step: peak detection and measurement ... Despite a lot of exposure to computerized data handling, however, many practicing chromatographers do not have a good idea of how a stored chromatogram file—a set of data points arrayed in time—gets translated into a set of peaks with quantitative attributes such as area, height, and amount.[1]
At this point, I noticed that the discussion tipped from an academic recitation of technical needs and possible solutions to a session driven primarily by frustrations. Even today, the instruments are often more sophisticated than the average user, whether he/she is a technician, graduate student, scientist, or principal investigator using chromatography as part of the project. Who is responsible for generating good data? Can the designs be improved to increase data integrity?[2]
We can expect that the same issue holds true for even more demanding individual or combined techniques. Unless lab personnel are well-educated in both the theory and the practice of their work, no amount of automation—including any IDS components—is going to matter in the development of usable data and information.
The IDS entered the laboratory initially as an aid to analysts doing their work. Its primary role was to off-load tedious measurements and calculations, giving analysts more time to inspect and evaluate lab results. The IDS has since morphed from a convenience to a necessity, and then to being a presumed part of an instrument system. That raises two sets of issues that we’ll address here regarding people, technologies, and their intersections:
1. People: Do the users of an IDS understand what is happening to their data once it leaves the instrument and enters the computer? Do they understand the settings that are available and the effect they have on data processing, as well as the potential for compromising the results of the analytical bench work? Are lab personnel educated so that they are effective and competent users of all the technologies used in the course of their work?
2. Technologies: Are the systems we are using up to the task that has been assigned to them as we automate laboratory functions?
We’ll begin with some basic material and then develop the argument from there.
An overall model for laboratory processes and instrumentation
Laboratory work is dependent upon instruments, and the push for higher productivity is driving us toward automation. What may be lost in all this, particularly to those new to lab procedures, is an understanding of how things work, and how computer systems control the final steps in a process. Without that understanding, good bench work can be reduced to bad and misleading results. If you want to guard against that prospect, you have to understand how instrument data systems work, as well as your role in ensuring accurate results.
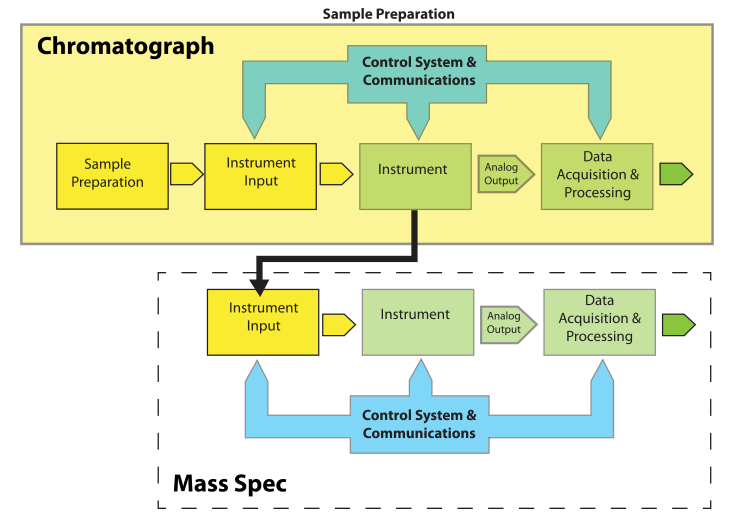
Let's begin by looking at a model for lab processes (Figure 1) and define the important elements.
|
Most of the elements of Figure 1 are easy to understand. "Instrument Input" could be an injection port, an autosampler, or the pan on a balance. “Control Systems & Communications,” normally part of the same electronics package as “Data Acquisition & Processing,” is separated out to provide for hierarchical control configurations that might be found in, e.g., robotics systems. The model is easily expanded to describe hyphenated systems such as gas chromatography–mass spectrometry (GC-MS) applications, as shown in Figure 2. Mass spectrometers are best used when you have a clean sample (no contaminants), while chromatographs are great at separating mixtures and isolating components in the effluent. The combination of instruments makes an effective tool for separating and identifying the components in mixtures.
|
Note that the chromatographic system and its associated components become the "Sample Preparation" element from Figure 1 when viewed from the perspective of the mass spectrometer (MS). The flow out of the chromatographic column is split (if needed, depending on the detector used, while controlling the input to the MS) so that the eluted material is directed to the input of the MS. Each eluted component from the chromatograph becomes a sample to the MS.
Instruments vs. instrument packages
One important feature of the model shown in Figure 1 is that arrow labeled “Analog Output”; this emphasizes that the standard output of instruments is an analog "response" or voltage. The response can take the form of a needle movement across a scale, a deflection, or some other indication (e.g., a level in a mercury or alcohol thermometer). Voltage output can be read with a meter or strip chart recorder. There are no instruments with digital outputs; they are all analog output devices.
On the other hand, instruments that appear to be digital devices are the result of packaging by the manufacturer. That packaging contains the analog signal-generating instrument, with a voltage output that is connected to an analog-to-digital converter.
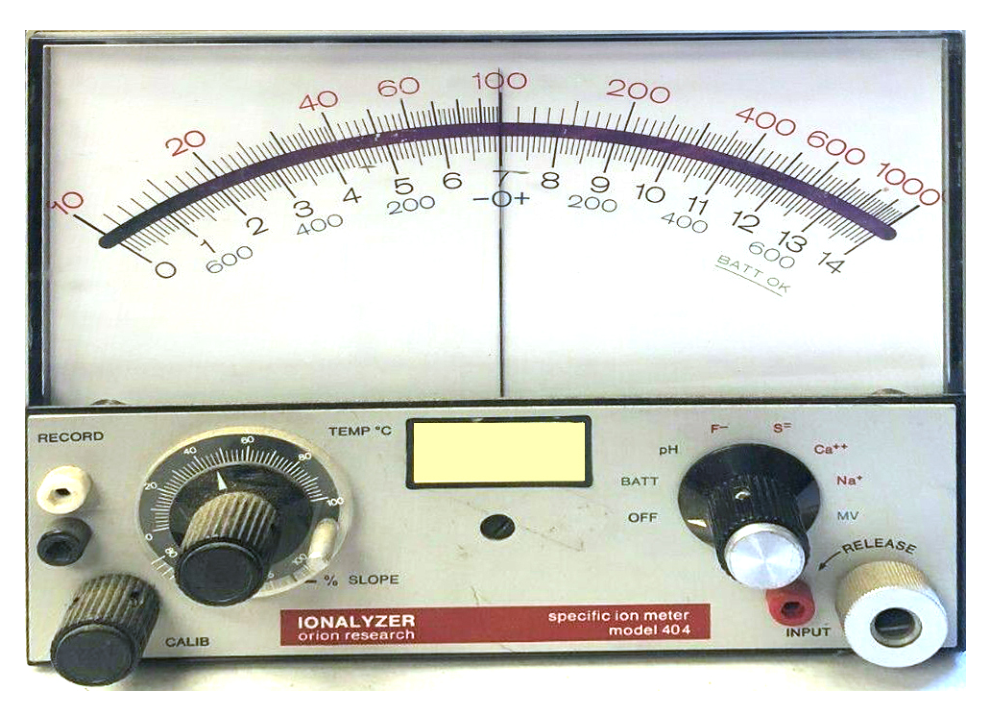
Take for example analog pH meters, which are in reality millivolt meters with a pH scale added to the meter face. If you look at Figure 3, the lower switch position has a setting for both MV (millivolt) and pH. When you read the pH on the meter, you are doing an analog-to-digital conversion; the needle's movement is the result of the incoming voltage from the pH electrode. The “pH reading” is performed by you as you project the needle's position onto the scale and note the corresponding numeric value.
|
A digital pH meter has the following components from our model (Figure 1) incorporated into the instrument package (the light green elements in the model):
- The instrument - One or more electrodes provide the analog signal, which depends on the pH of the solution.
- Data acquisition and processing – An external connection connects the electrodes to an analog-to-digital converter that converts the incoming voltage to a digital value that is in turn used to calculate the pH.
- Control systems and communication – This manages the digital display, front panel control functions, and, if present, the RS-232/422/485 or network communications. If the communications feature is there, this module also interprets and responds to commands from an external computer.
Working with more sophisticated instruments
Prior to the introduction of computers to instruments, the common method of viewing the instruments output was through meters and strip-chart recorders. That meant two things: all the measurements and calculations were done by hand, and you were intimately familiar with your data. Both those points are significant and have ramifications that warrant serious consideration in today’s labs.
In order to keep things simple, let's focus on chromatography, although the points raised will have application to spectroscopy, thermal analysis, and other instrumental techniques in chemistry; material science; physics; and other domains. Chromatography has the richest history of automation in laboratory work, it is widely used, and gives us a model for thinking about other techniques. You will not have to be an expert in chromatography to understand what follows.[a] To put it simply, chromatography is a technique for taking complex mixtures and allowing the analyst (with a bit of work) to separate the components of the mixture and determine what those components might be and quantify them.
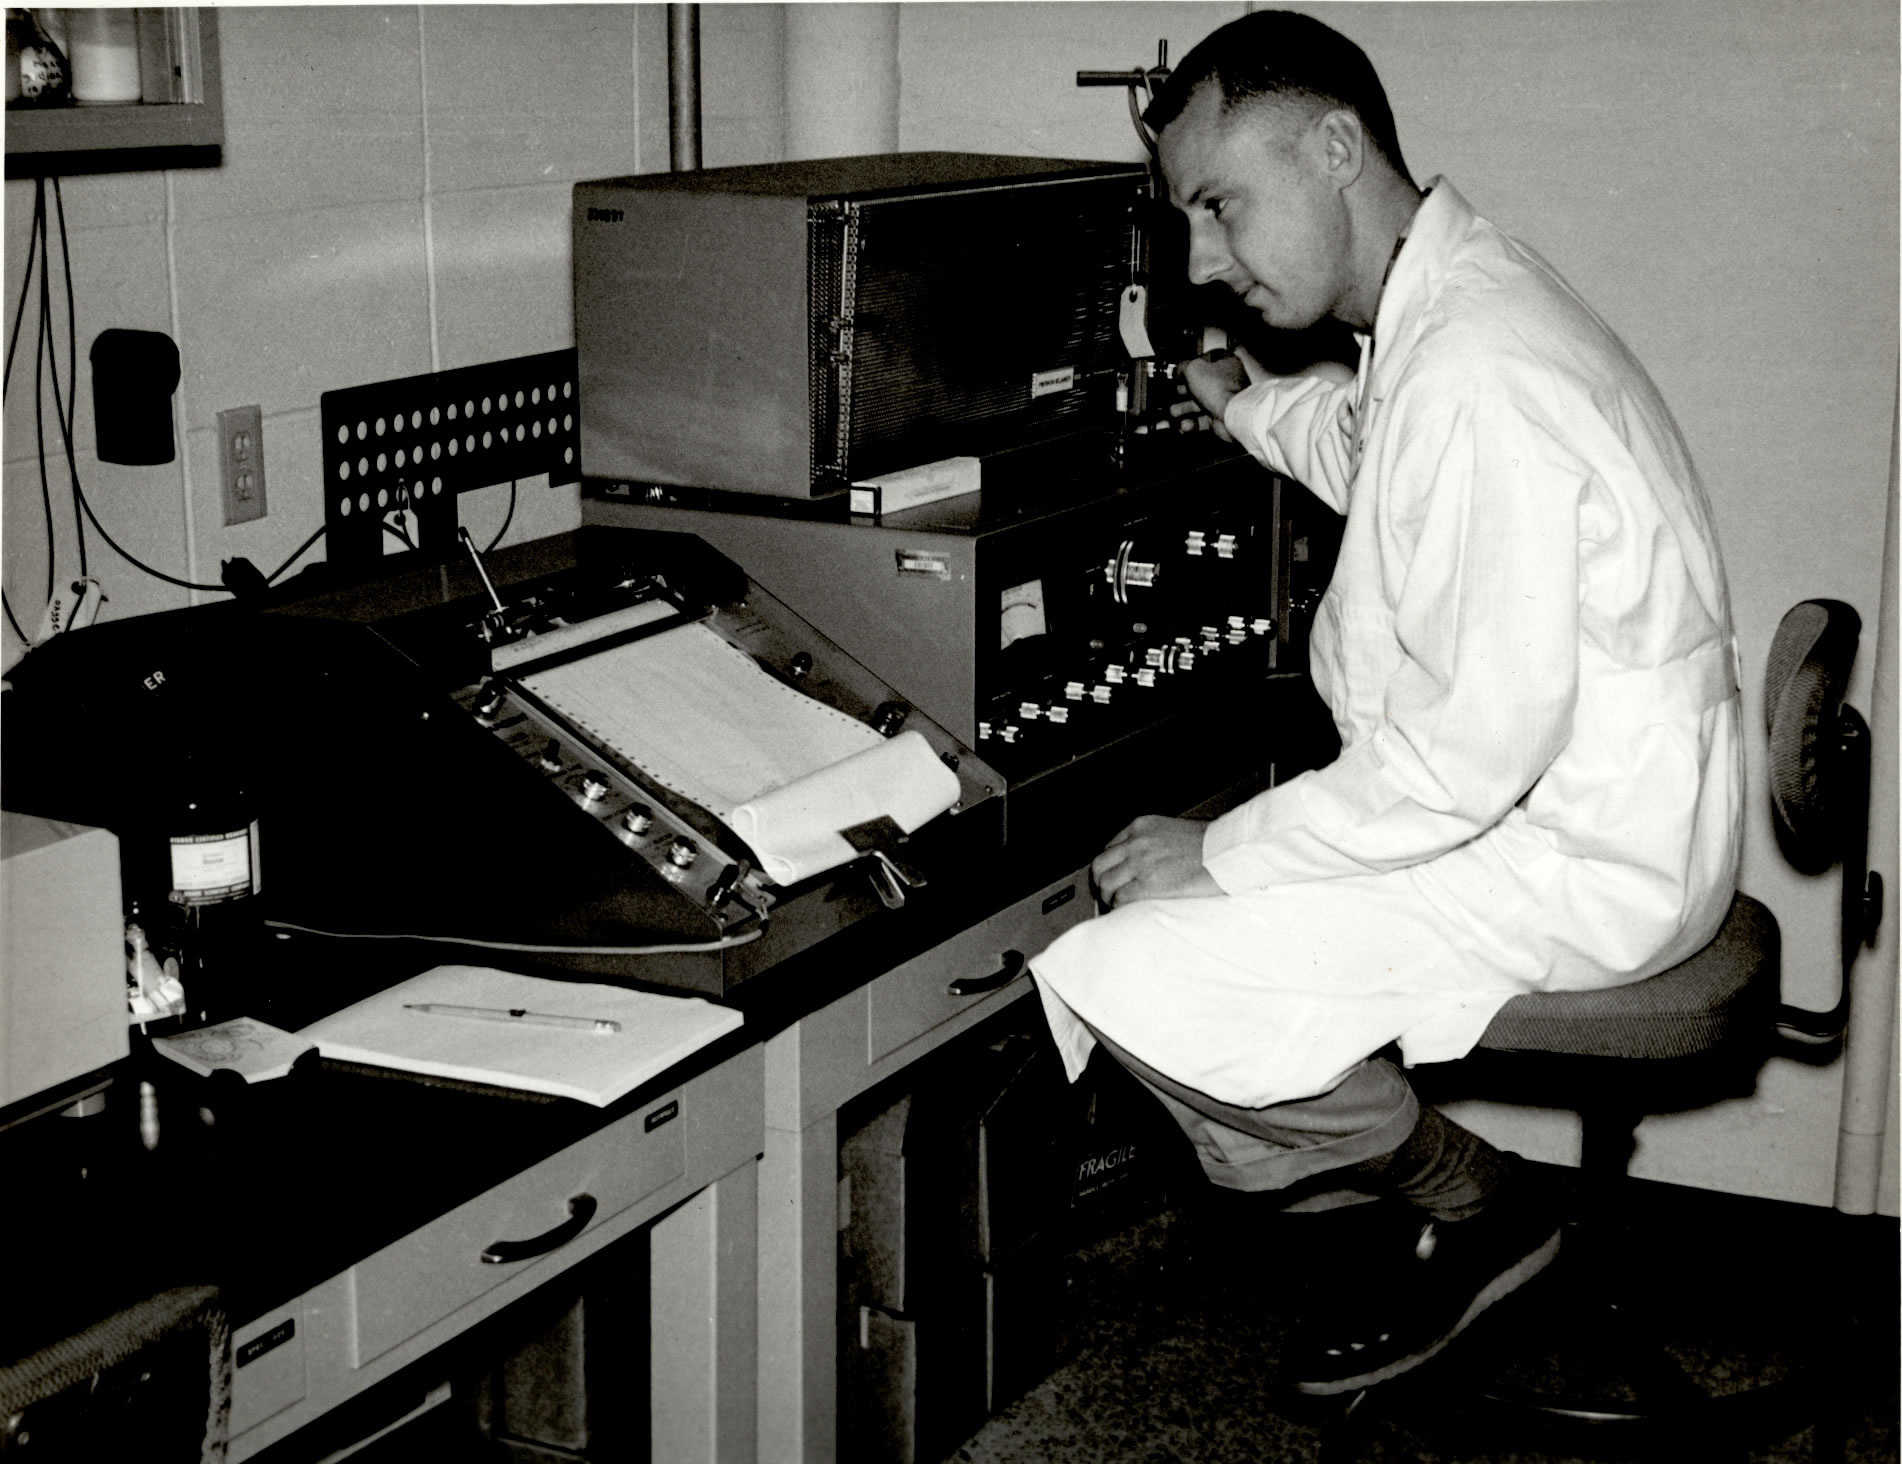
Older chromatographs looked like the instrument in front of the technician in Figure 4:
|
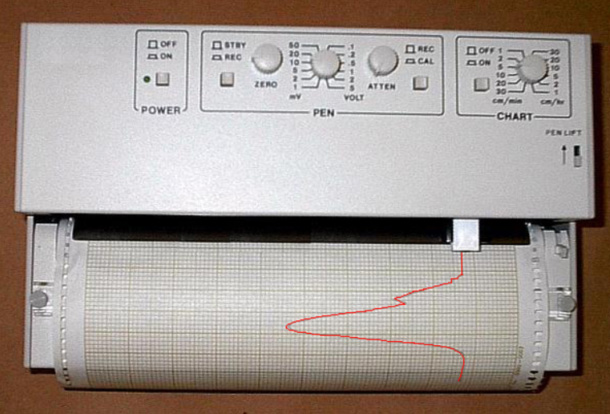
The instruments output was an analog signal, a voltage, that was recorded on a strip-chart recorder using a pen trace on moving chart paper, as shown in Figure 5 (the red line is the recorded signal; the baseline would be on the right).
|
The output of the instrument is a voltage (the “Analog Output” element in the model) that is connected to the recorder. The “Data Acquisition & Processing” and “Control Systems & Communication” elements are, to put it simply, you and your calculator.
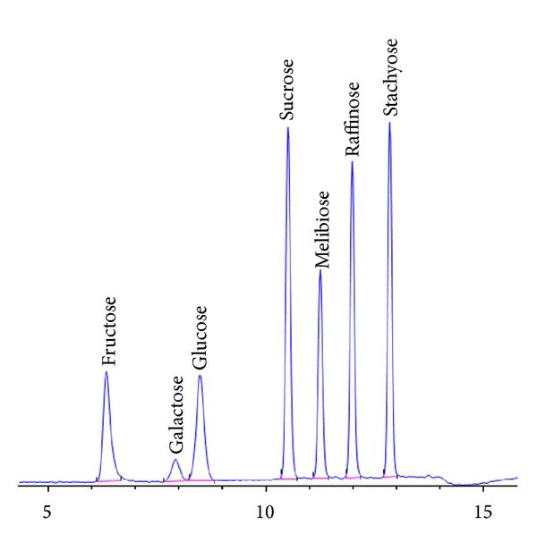
Now let's look at a typical chromatogram from a modern instrument (Figure 6).
|
As Figure 6 demonstrates, chromatograms are a series of peaks. Those peaks represent the retention time (how long it takes a molecule to elute after injection) and can be used to help determine a molecule's identity (other techniques such as MS may be used to confirm it). The size of the peak is used in quantitative analysis.
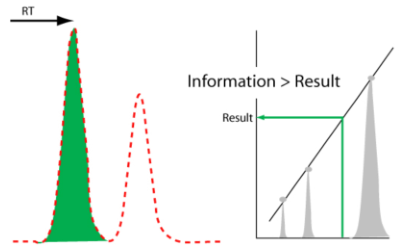
When doing quantitative analysis, part of the analyst's work is to determine the size of the peak and to ensure that there are no contaminants that would compromise the sample. This is where life gets interesting. Quantitative analysis requires the analysis of a series of standards used to construct a calibration curve (peak size vs. concentration), followed by the sample's. Their peak sizes are then placed on the calibration curve and their concentrations read (Figure 7).
|
Peak size can be measured two ways: by the height of the peak above a baseline and by measuring the area under the peak above that baseline. The latter is more accurate, but in the days before computers, this was difficult to determine because peaks have irregular shapes, often with sloping baselines. As a result, unless there was a concern, peak height was often used as it was faster and easier.
When done manually from strip chart recordings, there were two commonly used methods of measuring peak areas[4]:
- Planimeters – a mechanical device used to trace the peak outline, which was tedious, exacting, and time-consuming
- Cut-and-weigh – photocopies (usually) were made of the individual chromatograms, the peaks were cut out from the paper, put in a desiccator to normalize moisture content, and weighed. The weights, along with the surface area of the paper, were used to determine peak area, which was also slow, exacting, and time-consuming
While peak height measurements were faster, they were still labor-intensive. There was one benefit to these methodologies: you were intimately familiar with the data. If anything was even a little off—including unexpected peaks, distortion of peak shapes, etc.—it was immediately noticeable and important because that meant that there was something unexpected in the sample, which could mean serious contamination. Part of the analyst’s role was to identify those contaminants, which usually meant multiple injections and cold trapping of the peak components as they left the column. In the past, infrared spectrophotometry was used to scan the trapped material. Today, people use mass spectrometry methods, e.g., liquid chromatography–mass spectrometry (LC-MS).
Anything that could make those measurements easier and faster was welcomed into the lab (depending on your budget). “Anything” began with electronic integrators built around the Intel 4004 and 8008 chips[5][6] The integrators, connected to the analog output of the chromatograph, performed the data acquisition and processing to yield a paper strip with the peak number, retention time, peak height, peak area, and an indication if the peak ended on the baseline or formed a valley with a following peak, for all the peaks resulting from an injection. Most integrators had both digital (connecting to a digital I/O board) and serial (RS-232) input-output (I/O) ports for communication to a computer.
With the change in technologies and methods, some things were gained, others lost. There was certainly an increased speed of measuring peak characteristics, with the final results calculations being left to the analyst. However, any intimacy with the data was largely lost, as was some control over how baselines were measured, and how peak areas for overlapping peaks were partitioned. Additionally, unless a strip chart is connected to the same output as the integrator used, you don't see the chromatograms, making it easy to miss possible contaminants that would otherwise be evident by more obvious extra peaks or distorted peaks.
As instrumentation has developed, computers and software have become more accepted as part of lab operations, and the distinction between the instrument and the computational system has almost become lost. For example, strip-chart recorders, once standard, has become an optional accessory. Today, the computer's report has become an accepted summary of analysis, and, if referenced, a screen-sized graphic has become an acceptable representation of the chromatogram output, if captured. If the analyst chooses to do so, the digital chromatogram can be enlarged to see more detail. Additionally, considerable computing resources are available today to analyze peaks and what they might represent through hyphenated techniques. However, those elements are only useful if someone inspects the chromatogram and looks for anomalies that could take the form of unexpected peaks or distorted peak shapes.
Issues with potential contaminants can be planned for by developing separation methods that properly separate all expected sample components and possible contaminants. The standard printed report will list everything found, including both expected molecules and those that could be there but shouldn’t. There are also the unexpected things that show up either as well-defined peaks or shoulders to other eluted components.
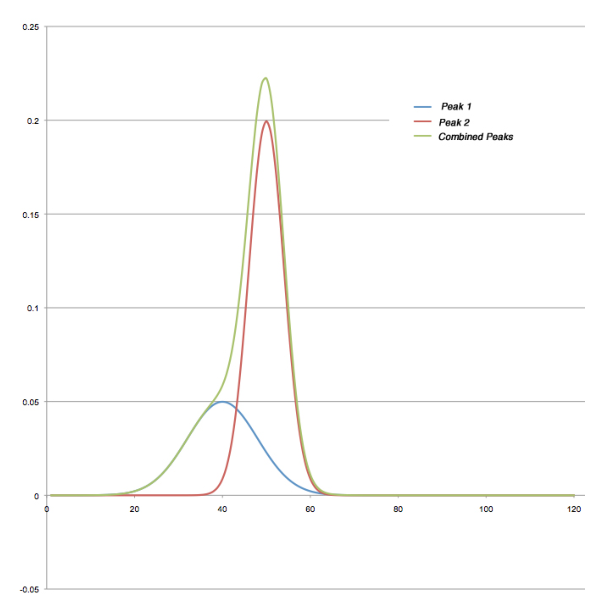
Figure 8 shows a pair of synthesized peaks (created in Excel) based on a normal distribution. The blue and red lines are the individual peaks, and the green is their combination. While the contribution of the blue peak is significant and distorts the overall peak envelope, it isn’t sufficient to disrupt the continually ascending slope on the leading edge. The end result is that peak detection algorithms would likely lump the two areas together and report them as a single component; the retention time of the second peak was not affected. It may be possible to pick a set of peak detection parameters that would detect this, or an analytical report that would flag the unusual peak width (proportional to a standard’s peak height). This would be something the analyst would have to build in rather than relying on default settings and reports.
|
The same issues exist in other techniques such as spectroscopy and thermal analysis. In those techniques, there may not be much that can be done in the analytical phase[b] to deal with the problem, and you may have to use software systems to handle the problem. Peak deconvolution represents one possible method.
There are examples of performing peak deconvolution with software packages, including from OriginLab[7] and Wolfram Research.[8] One potential problem with deconvolution, however, is that too many peaks may be created to make the curve fitting match.
In the end, the success of all these methods depends upon well-educated analysts who are thoroughly familiar with the techniques they are using and the capabilities of the data handling systems used to collect and analyze instrument output.
Moving to fully automated, interconnected systems
One of the benefits of a laboratory information management system (LIMS) and electronic laboratory notebook (ELN) is their ability to receive communications from an IDS and automatically parse reports and enter results into their databases. Given the previous commentary, how do we ensure that the results being entered are correct? The IDS has moved from being an aid to the analyst to a replacement, losing the analyst's observation and judgment facilities. That can compromise data quality and integrity, permitting questionable data and information into the system. We need to find an effective substitute for the analyst as we move toward fully automated lab environments.
What needs to be developed on an industry-wide basis (it may exist in individual products or labs) is a system that verifies, certifies, and notifies of analytical results while also addressing the concerns raised above. Given the expanding interest in artificial intelligence (AI) systems, that would seem to be one path, but there are problems there. Most of the AI systems reported in the press are devised around machine learning processes based on the system's examination of test data sets, frequently in the form of images that can be evaluated. As of this writing, there are concerns being raised about the quality of the data sets and the reliability of the resulting systems. Another problem is that the decision-making process of machine-learning based systems is a black box, which wouldn’t work in a regulated environment where validation does and should be a major concern. In short, if you don’t know how it works, how do you develop trust in the results? After all, trust in the data is critical.
What we will need is a deliberately designed system to detect anomalies in analytical and experimental data that allows users to take appropriate follow-up actions. When applied to an IDS, this functionality would act as a “gatekeeper” and prevent questionable information from entering laboratory informatics systems (Figure 9).
|
The concept of a “data and information gatekeeper” is an interesting point as we move forward into automation and the integration of laboratory informatics systems. We have the ability to connect systems together and transfer data and information from an IDS to a scientific data management system (SDMS), and then to a LIMS or ELN. Once that data and information enters this upper tier of informatics, it is generally considered to be trustworthy and able to be used on a reliable basis for decision making. That trustworthiness needs to be based on more than the ability to put stuff into a database. We need to ensure that the process of developing data and information is reliable, tested, and validated. This is part of the attraction of a laboratory execution system (LES), which has built-in checks to ensure a process’ steps are performed properly. While a LES is primarily built to support human activities, we need a similar mechanism for checks on automated processes—and in particular the final stages of data-to-information processing—in IDSs when throughput is so high that we can’t rely on human inspectors. As we move into increasing productivity through automation (essentially becoming “scientific manufacturing or production” work) we need to adapt production-line inspection concepts to the processes of laboratory work.
Setting a direction for laboratory automation development
This paper began with a statement that an industry-wide direction is needed to facilitate the use of automation technologies in lab work. You might first ask “which industry?” The answer is "all of them." There has been a tendency over the last several years to focus on the life science and healthcare industries, which is understandable as that’s largely where the money is. More recently, however, there has been a push made for the cannabis industry for the same reason: it makes for a wise investment. That's to say that labeling technologies as suitable for a particular industry misses the key point that laboratory automation and its supporting technology needs are basically the same across all industries. The samples and specifics of the processes differ in what people will use, but the underlying technologies are the same. Tools like microplates and supporting technologies are concentrated in life sciences, but to a large extent that's because they haven’t been tried elsewhere. The same holds true for software systems. Developers may have a more difficult time justifying projects if they are only targeted at one industry, but they may gain broader support if they take a wider view of the marketplace. If methods and standards are viewed as being marketplace-specific, they may be ignored by other potential users. As a result, developers will miss important input and opportunities that could make them more successful. In short, we need to be more inclusive in technology, looking for broader applicability of development rather than a narrowly focused one.
When we construct a framework for developments in laboratory automation and computing, we should address the laboratory marketplace as a whole and then let individual markets adapt and refine that framework as required for their needs. For example, inter-system communications (e.g., bi-directional IDS to LIMS or ELN) has been a need for decades, a need that has been successfully addressed by the clinical chemistry industry. So why not adapt their approach?
We could develop a set of models for various lab operations. The one described earlier is one possibility, but it would need to be fleshed out to include administrative and other types of functions. Each element would have different sub-models to account for implementation methods (e.g., manual, semi-automated, fully robotic, etc.) with connection and control mechanisms (hierarchical for robotics, and LES for manual). These models would show us where developments are needed and how they are interconnected, while also offering a guide for people planning lab operations. As such, it would become a more structured or engineered approach to the identification and development of integrated technologies.
But there's still another need, and that is proper education. This could be facilitated by the created models, helping people understand what they need to learn to be effective lab managers, technology managers, lab personnel, and laboratory IT (LAB-IT) support personnel.
Together, education and technology development offer a natural feedback system. The more you learn, the better your ability to define and utilize laboratory technology, from generation to generation. That interaction leads to more effective education.
The bottom line
The bottom line to all this is pretty simple. Instrument vendors have produced a wide range of instrument systems, supported by instrument data systems, to assist lab personnel in their work. Their role is to develop systems that can be adapted to support instruments, with the user completing the process of analysis and reporting. General purpose reporting can be reconfigured to meet specialized needs; after all, those vendor supplied reports aren’t the end of the process, just a guide to getting there.
Regardless of how an instrument is packaged (e.g., as integrated packages or separated instrument-computer configurations), the end user has to be well-educated in both sets of components. They have to understand:
- what the instrument is doing,
- how it functions, and
- the characteristics of the analog data it produces.
They also have to be familiar with:
- what digital systems do with that data,
- how they do it,
- the limitations of those systems,
- the interaction between the instrument and computer, and
- the responsibilities of the analyst.
Digital systems are not a replacement for the analyst, but rather they are an aid in streamlining workflows. Whatever data and information is produced, you are signing your name to it and are responsible for those results.
Abbreviations
AI: Artificial intelligence
ELN: Electronic laboratory notebook
GC-MS: Gas chromatography–mass spectrometry
IDS: Instrument data system
LC-MS: Liquid chromatography–mass spectrometry
LES: Laboratory execution system
LIMS: Laboratory information management system
MS: Mass spectrometer
SDMS: Scientific data management system
Footnotes
- ↑ If you’d like to familiarize yourself with the technique, however, there are a many sources online, e.g., Khan Academy.
- ↑ In some cases such as the infrared spectroscopic analysis of LDPE side-chain branching, interfering vinylidene peaks can be removed by bromination; see ASTM D3123 - 09(2017). Other techniques may have mechanisms for resolving the overlapping peak issue.
About the author
Initially educated as a chemist, author Joe Liscouski (joe dot liscouski at gmail dot com) is an experienced laboratory automation/computing professional with over forty years of experience in the field, including the design and development of automation systems (both custom and commercial systems), LIMS, robotics and data interchange standards. He also consults on the use of computing in laboratory work. He has held symposia on validation and presented technical material and short courses on laboratory automation and computing in the U.S., Europe, and Japan. He has worked/consulted in pharmaceutical, biotech, polymer, medical, and government laboratories. His current work centers on working with companies to establish planning programs for lab systems, developing effective support groups, and helping people with the application of automation and information technologies in research and quality control environments.
References
- ↑ Hinshaw, J.V. (2014). "Finding a Needle in a Haystack". LCGC Europe 27 (11): 584–89. https://www.chromatographyonline.com/view/finding-needle-haystack-0.
- ↑ Stevenson, R.L.; Lee, M.; Gras, R. (1 September 2011). "The Future of GC Instrumentation From the 35th International Symposium on Capillary Chromatography (ISCC)". American Laboratory. https://americanlaboratory.com/913-Technical-Articles/34439-The-Future-of-GC-Instrumentation-From-the-35th-International-Symposium-on-Capillary-Chromatography-ISCC/.
- ↑ Valliyodan, B.; Shi, H.; Nguyen, H.T. (2015). "A Simple Analytical Method for High-Throughput Screening of Major Sugars from Soybean by Normal-Phase HPLC with Evaporative Light Scattering Detection". Chromatography Research International 2015: 757649. doi:10.1155/2015/757649.
- ↑ Ball, D.L.; Harris, W.E.; Habgood, H.W. (1967). "Errors in Manual Integration Techniques for Chromatographic Peaks". Journal of Chromatographic Science 5 (12): 613–20. doi:10.1093/chromsci/5.12.613.
- ↑ Goedert, M.; Wise, S.A.; Juvet Jr., R.S. (1974). "Application of an inexpensive, general-purpose microcomputer in analytical chemistry". Chromatographia 7 (9): 539–46. doi:10.1007/BF02268338.
- ↑ Betteridge, D.; Goad, T.B. (1981). "The impact of microprocessors on analytical instrumentation. A review". Analyst 106 (1260): 257–82. doi:10.1039/AN9810600257.
- ↑ Mao, S. (9 March 2015). "How do I Perform Peak “Deconvolution”?". Origin Blog. OriginLab. http://blog.originlab.com/how-do-i-perform-peak-deconvolution.
- ↑ Binous, H.; Bellagi, A. (March 2010). "Deconvolution of a Chromatogram". Wolfram Demonstrations Project. https://demonstrations.wolfram.com/DeconvolutionOfAChromatogram/.

