File:Fig3 Fernández FrontPlantSci2023 14.jpg
Original file (3,198 × 1,004 pixels, file size: 167 KB, MIME type: image/jpeg)
Summary
| Description |
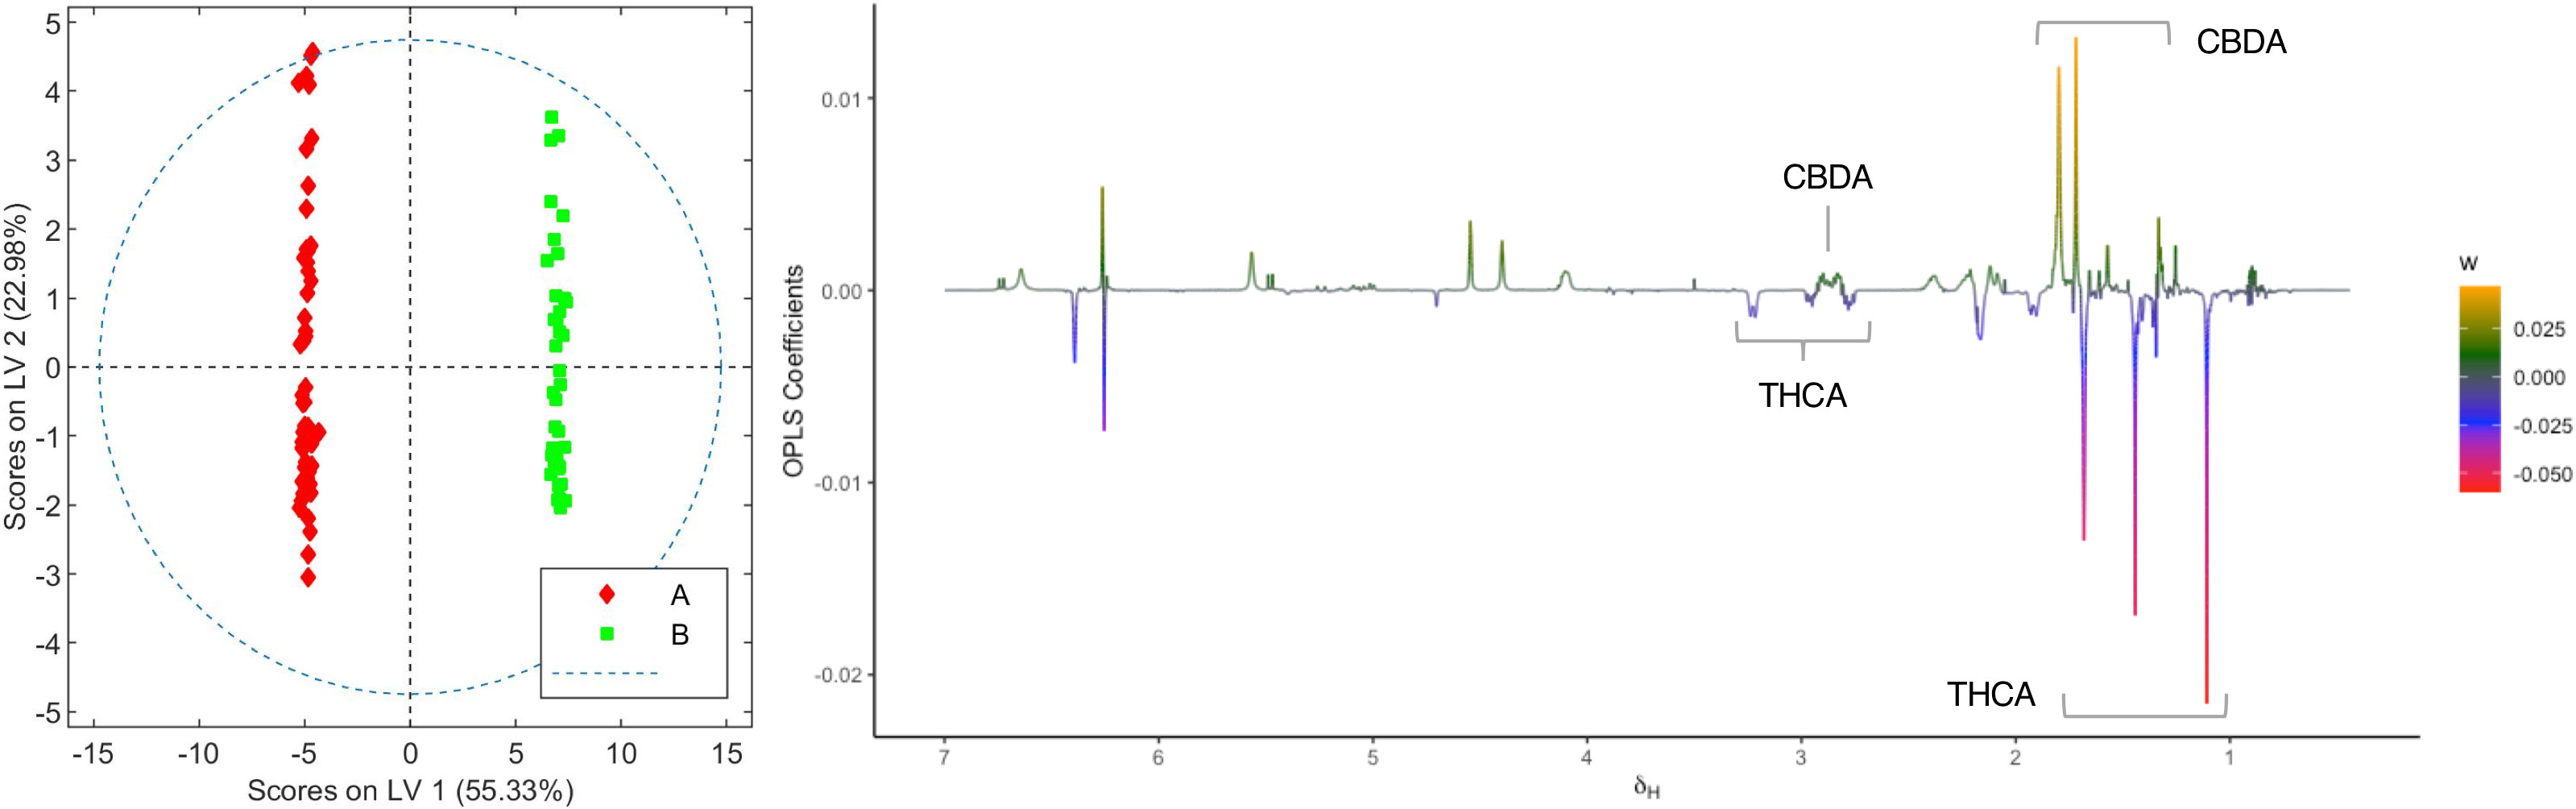
Fig. 3. Score and loading factor plots obtained from the OPLS-DA between organic extracts of chemovars A and B. The metabolites that differentiate the two groups are annotated in the loading factor plots. The R2Y and Q2Y coefficients for the model were 0.99 and 0.99, respectively, and the ROC curve had an AUC value of 1.00 (see Figures S1, S2). |
|---|---|
| Source |
Fernández, S.; Castro, R.; López-Radcenco, A.; Rodriguez, P.; Carrera, I.; García-Carnelli, C.; Moyna, G. (2023). "Beyond cannabinoids: Application of NMR-based metabolomics for the assessment of Cannabis sativa L. crop health". Frontiers in Plant Science 14: 1025932. doi:10.3389/fpls.2023.1025932. |
| Date |
2023 |
| Author |
Fernández, S.; Castro, R.; López-Radcenco, A.; Rodriguez, P.; Carrera, I.; García-Carnelli, C.; Moyna, G. |
| Permission (Reusing this file) |
|
| Other versions |
Licensing
|
|
This work is licensed under the Creative Commons Attribution 4.0 License. |
File history
Click on a date/time to view the file as it appeared at that time.
| Date/Time | Thumbnail | Dimensions | User | Comment | |
|---|---|---|---|---|---|
| current | 22:02, 26 December 2023 | 3,198 × 1,004 (167 KB) | Shawndouglas (talk | contribs) |
You cannot overwrite this file.
File usage
The following page uses this file:


