File:Fig2 Chambers JofCannRes23 5.png
Original file (1,944 × 917 pixels, file size: 975 KB, MIME type: image/png)
Summary
| Description |
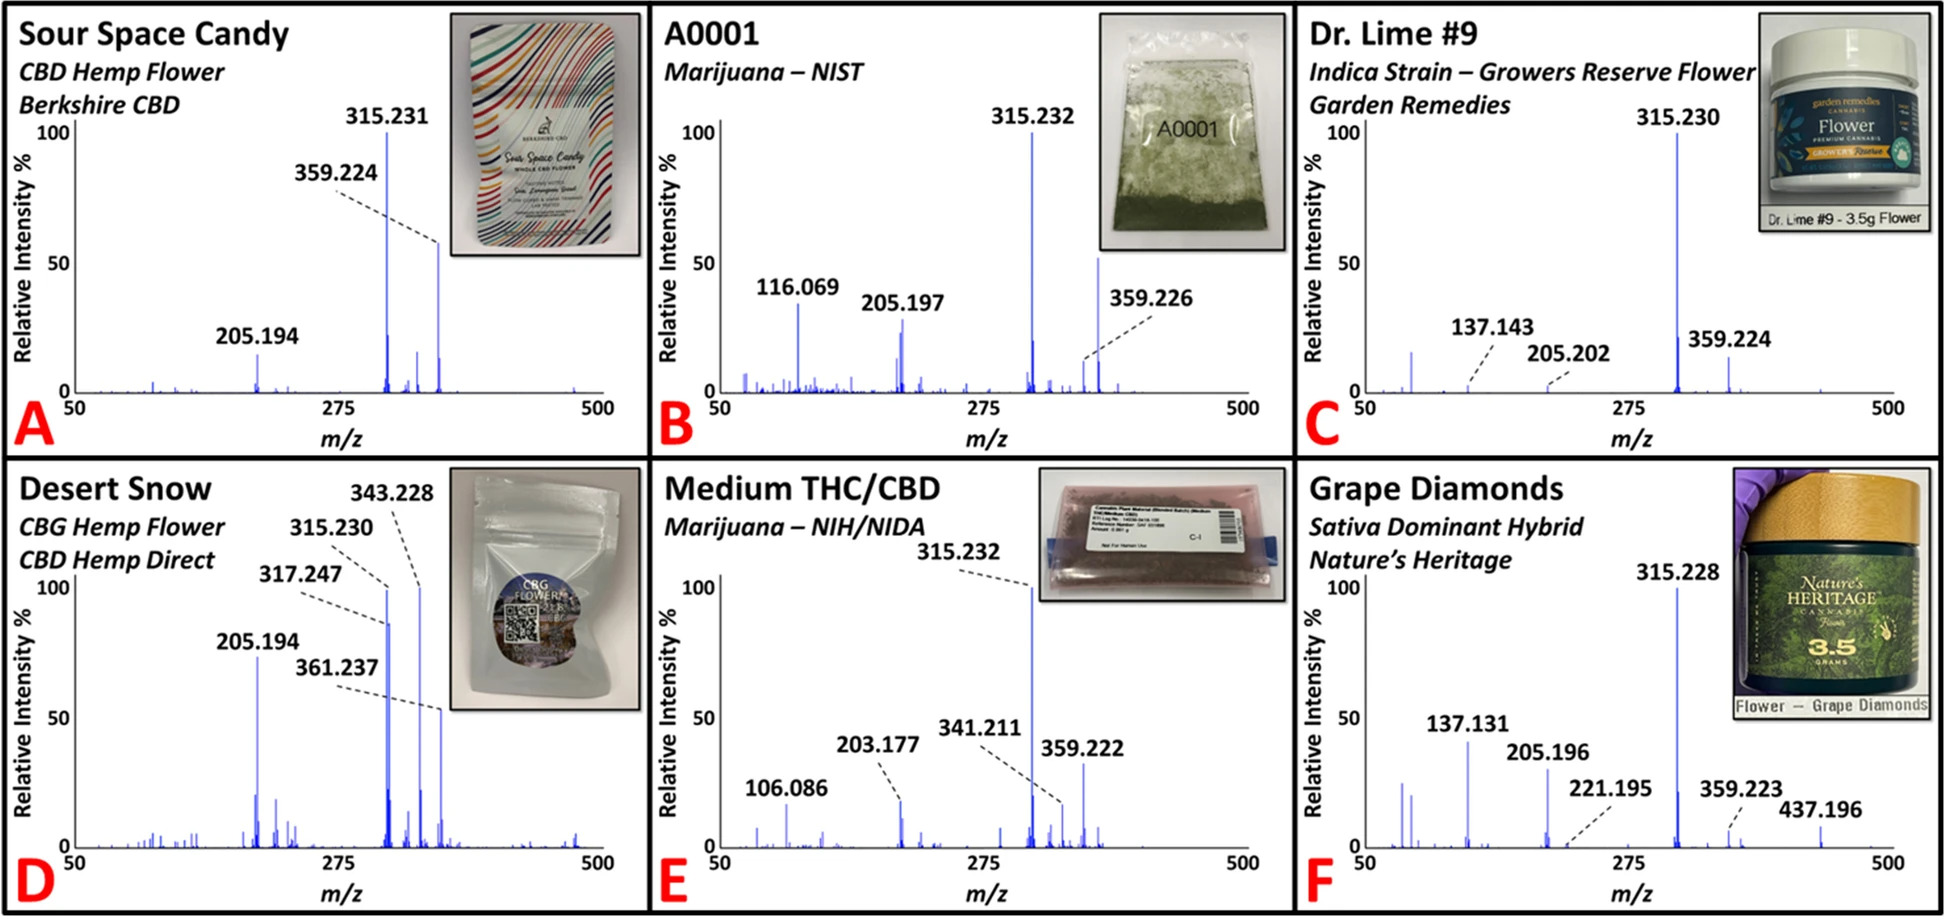
Fig. 2 Representative DART-HR mass spectra of commercial hemp flower (panels A and D), marijuana samples supplied by NIST (panel B) and NIDA (panel E), and recreational marijuana flower products (panels C and F). Peaks consistent with the protonated masses of THC/CBD, CBG, THCA/CBDA, and CBGA at nominal m/z 315, 317, 359, and 361, respectively, were detected in the various samples. |
|---|---|
| Source |
Chambers, M.I.; Beyramysoltan, S.; Garosi, B.; Musah, R.A. (2023). "Combined ambient ionization mass spectrometric and chemometric approach for the differentiation of hemp and marijuana varieties of Cannabis sativa". Journal of Cannabis Research 5: 5. doi:10.1186/s42238-023-00173-0. |
| Date |
2023 |
| Author |
Chambers, M.I.; Beyramysoltan, S.; Garosi, B.; Musah, R.A. |
| Permission (Reusing this file) |
|
| Other versions |
Licensing
|
|
This work is licensed under the Creative Commons Attribution 4.0 License. |
File history
Click on a date/time to view the file as it appeared at that time.
| Date/Time | Thumbnail | Dimensions | User | Comment | |
|---|---|---|---|---|---|
| current | 21:33, 26 December 2023 | | 1,944 × 917 (975 KB) | Shawndouglas (talk | contribs) |
You cannot overwrite this file.


