File:Fig2 Bowen ScientificReports21 11.png
Original file (1,994 × 1,972 pixels, file size: 1.27 MB, MIME type: image/png)
Summary
| Description |
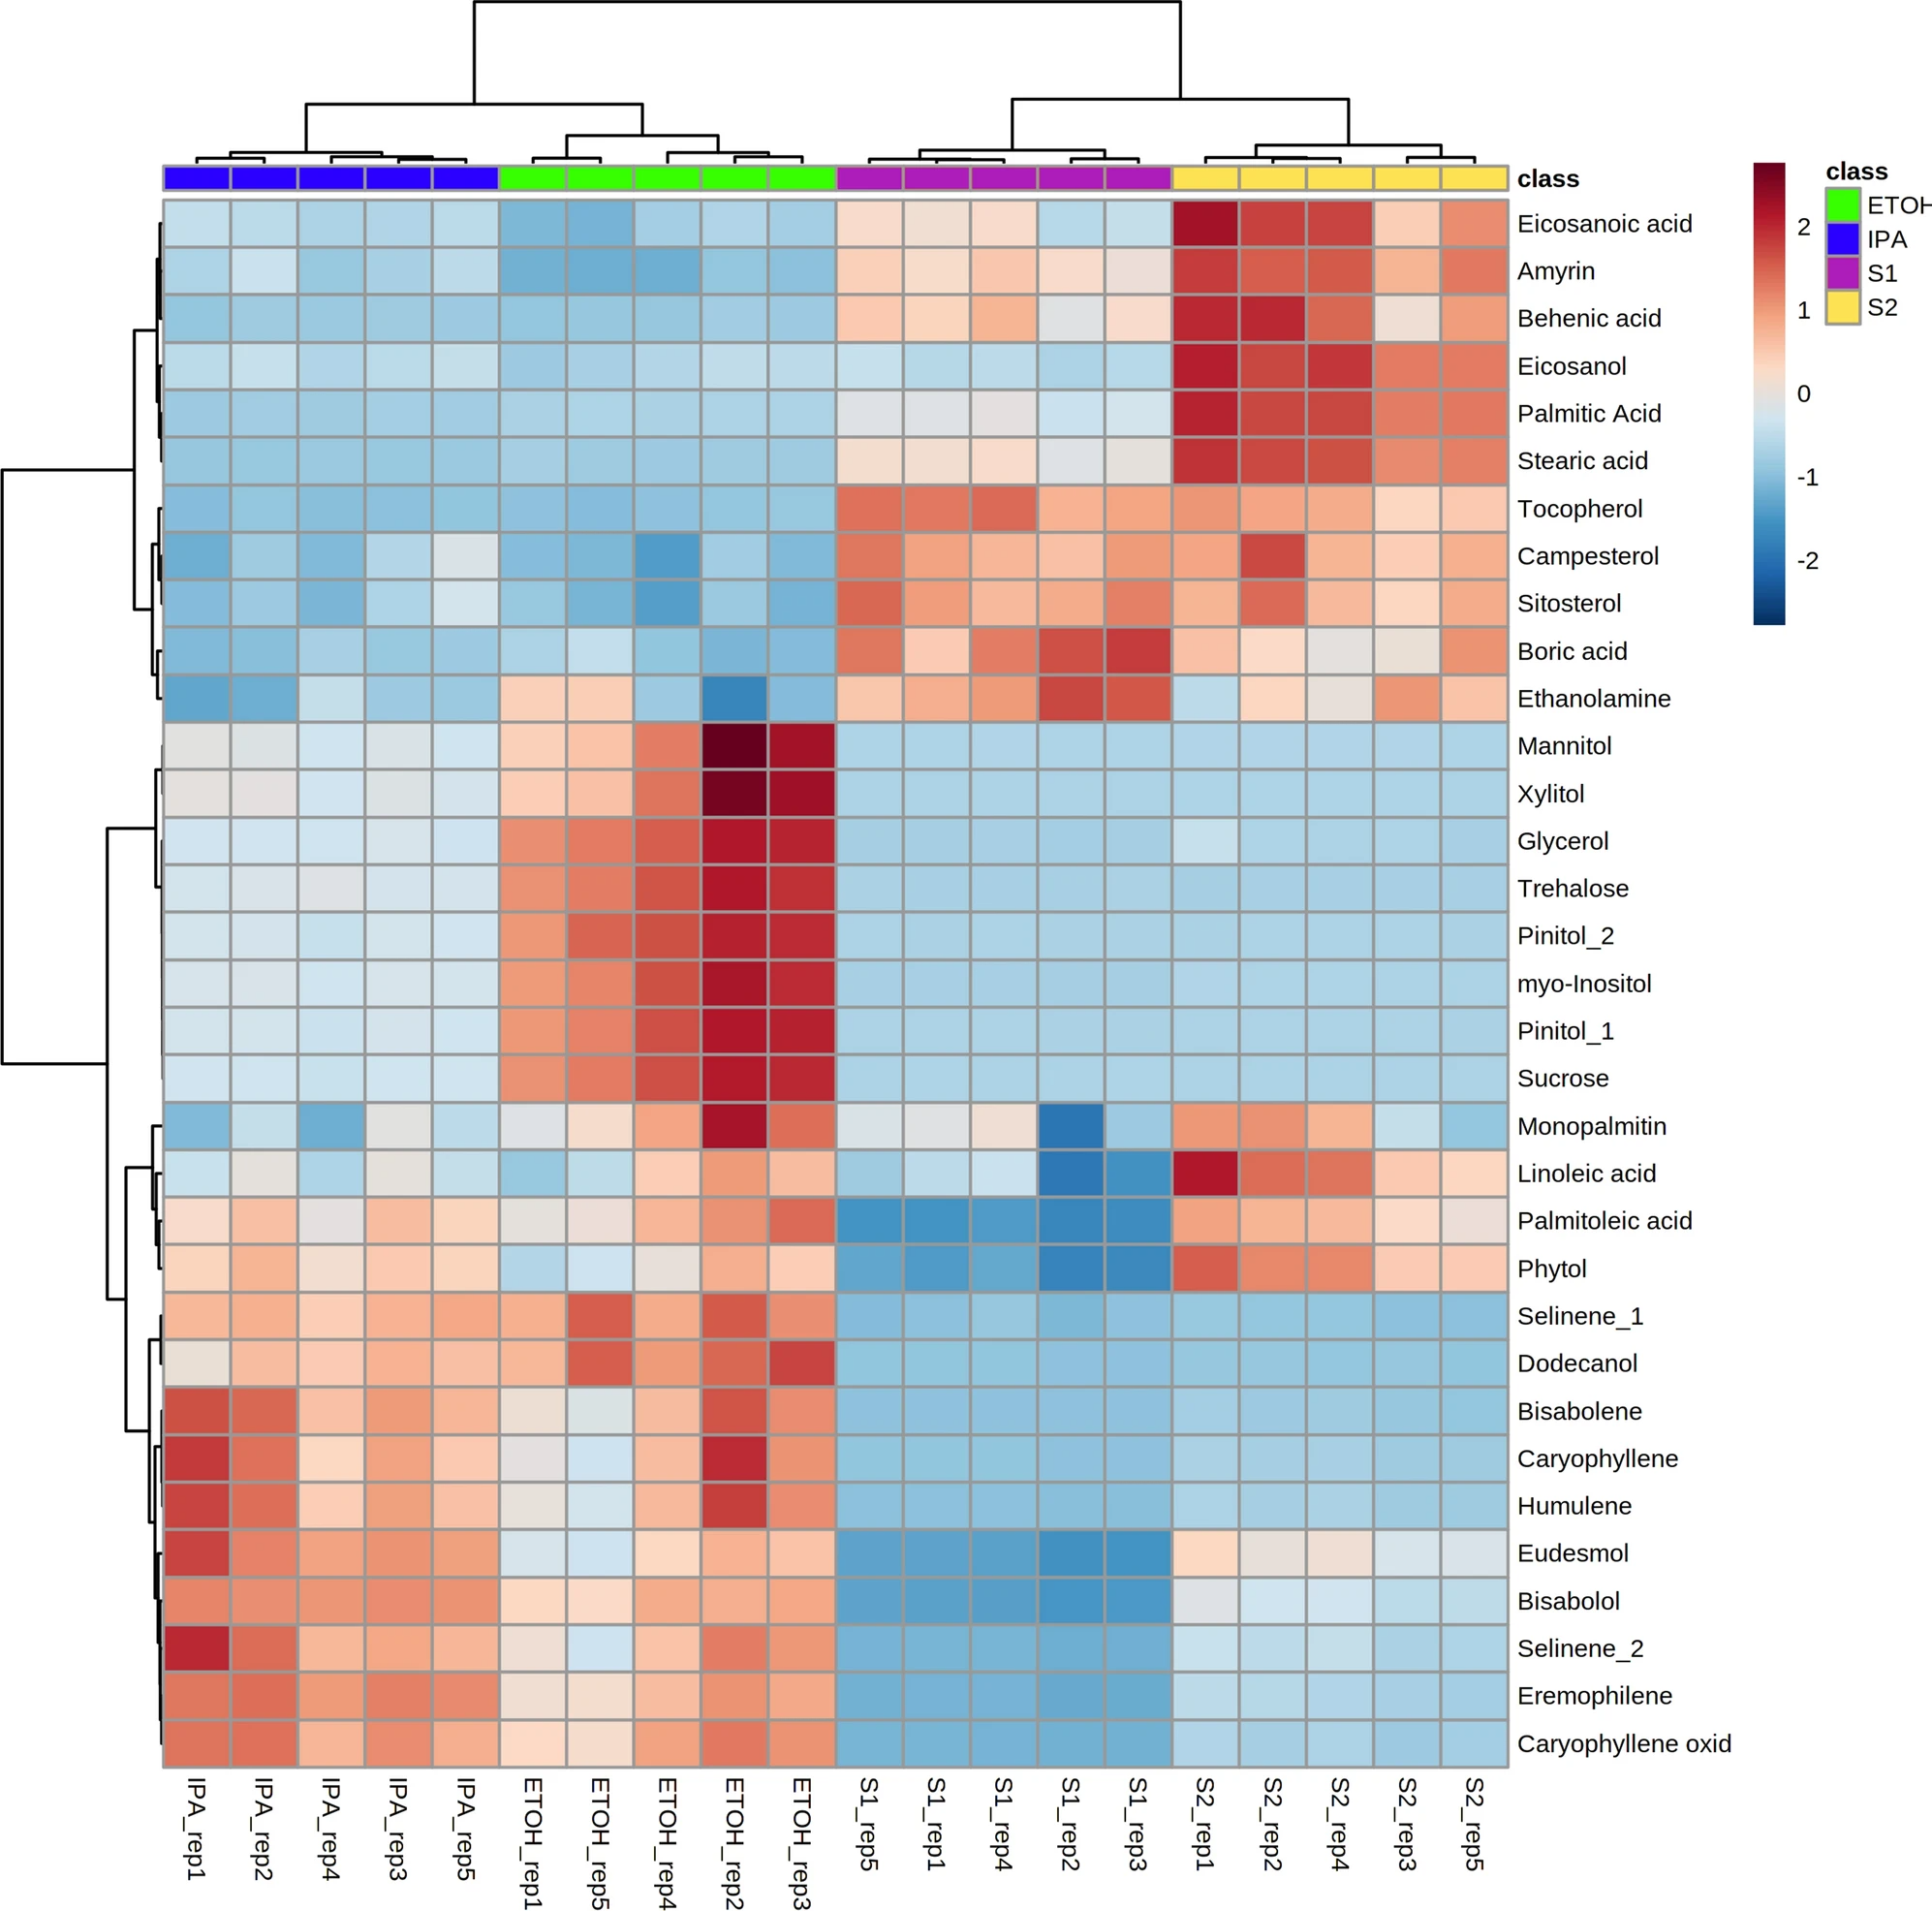
Fig. 2 Heatmap of the compounds detected and annotated by GC–MS, showing significantly different in abundance across the four extracts (p < 0.05 after Tukey post-hoc testing for multiple comparisons). Green = ethanol extract; Blue = isopropanol extract; Purple and Yellow = supercritical CO2 fractions S1 and S2, respectively. |
|---|---|
| Source |
Bowen, J.K.; Chaparro, J.M.; McCorkle, A.M.; Palumbo, E.; Prenni, J.E. (2021). "The impact of extraction protocol on the chemical profile of cannabis extracts from a single cultivar". Scientific Reports 11: 21801. doi:10.1038/s41598-021-01378-0. |
| Date |
2021 |
| Author |
Bowen, J.K.; Chaparro, J.M.; McCorkle, A.M.; Palumbo, E.; Prenni, J.E. |
| Permission (Reusing this file) |
|
| Other versions |
Licensing
|
|
This work is licensed under the Creative Commons Attribution 4.0 License. |
File history
Click on a date/time to view the file as it appeared at that time.
| Date/Time | Thumbnail | Dimensions | User | Comment | |
|---|---|---|---|---|---|
| current | 21:32, 26 December 2023 | | 1,994 × 1,972 (1.27 MB) | Shawndouglas (talk | contribs) |
You cannot overwrite this file.
File usage
The following page uses this file:


