File:Fig1 Morehouse SNApplSci2021 3.png
Original file (1,498 × 916 pixels, file size: 33 KB, MIME type: image/png)
Summary
| Description |
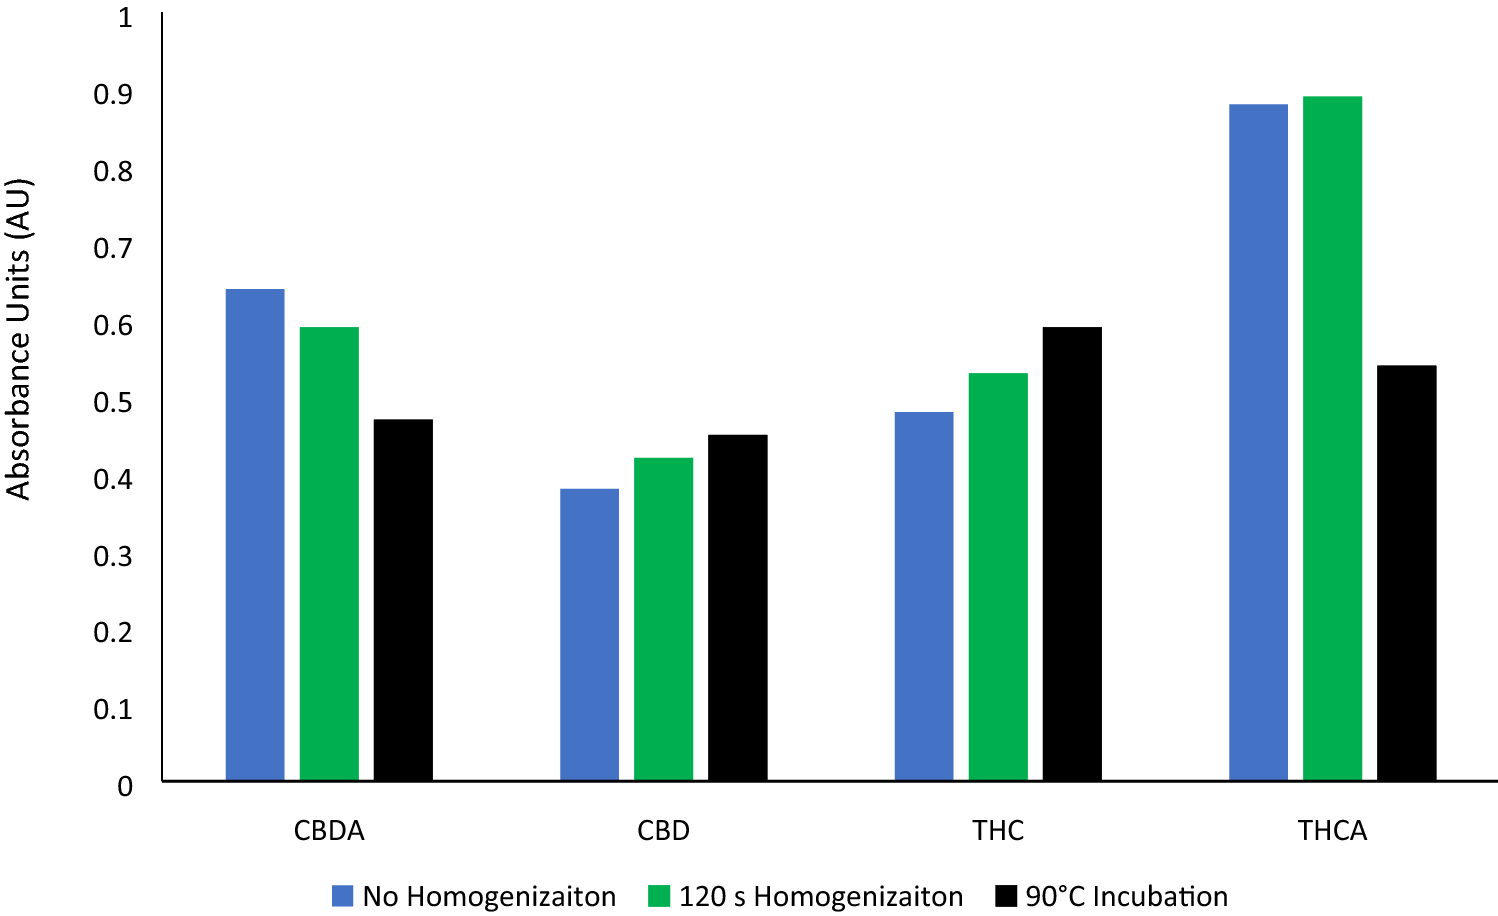
Fig. 1 Reverse HPLC results visualizing CBDA, CBD, THCA, and THC concentrations as absorbance units following hemp homogenization (green), 90 C heating of sample (black), and no sample preparation (blue) |
|---|---|
| Source |
Morehouse, Z.P.; Ryan, G.L.; Proctor, C.M.; Okparanta, A.; Todd, W.; Bunting, D.; White, T.; Parez, S.; Miller, B.; Colon, V.; Easparro, B.; Atwood, J.; Park, Y.; Nash, R.J. (2021). "A proposed method of sample preparation and homogenization of hemp for the molecular analysis of cannabinoids". SN Applied Sciences 3: 762. doi:10.1007/s42452-021-04747-6. |
| Date |
2021 |
| Author |
Morehouse, Z.P.; Ryan, G.L.; Proctor, C.M.; Okparanta, A.; Todd, W.; Bunting, D.; White, T.; Parez, S.; Miller, B.; Colon, V.; Easparro, B.; Atwood, J.; Park, Y.; Nash, R.J. |
| Permission (Reusing this file) |
|
| Other versions |
Licensing
|
|
This work is licensed under the Creative Commons Attribution 4.0 License. |
File history
Click on a date/time to view the file as it appeared at that time.
| Date/Time | Thumbnail | Dimensions | User | Comment | |
|---|---|---|---|---|---|
| current | 21:15, 26 December 2023 | | 1,498 × 916 (33 KB) | Shawndouglas (talk | contribs) |
You cannot overwrite this file.
File usage
The following page uses this file:


