File:Fig3 Auer CytometryPartA2018 93-7.jpg

Original file (2,128 × 1,371 pixels, file size: 325 KB, MIME type: image/jpeg)
Summary
| Description |
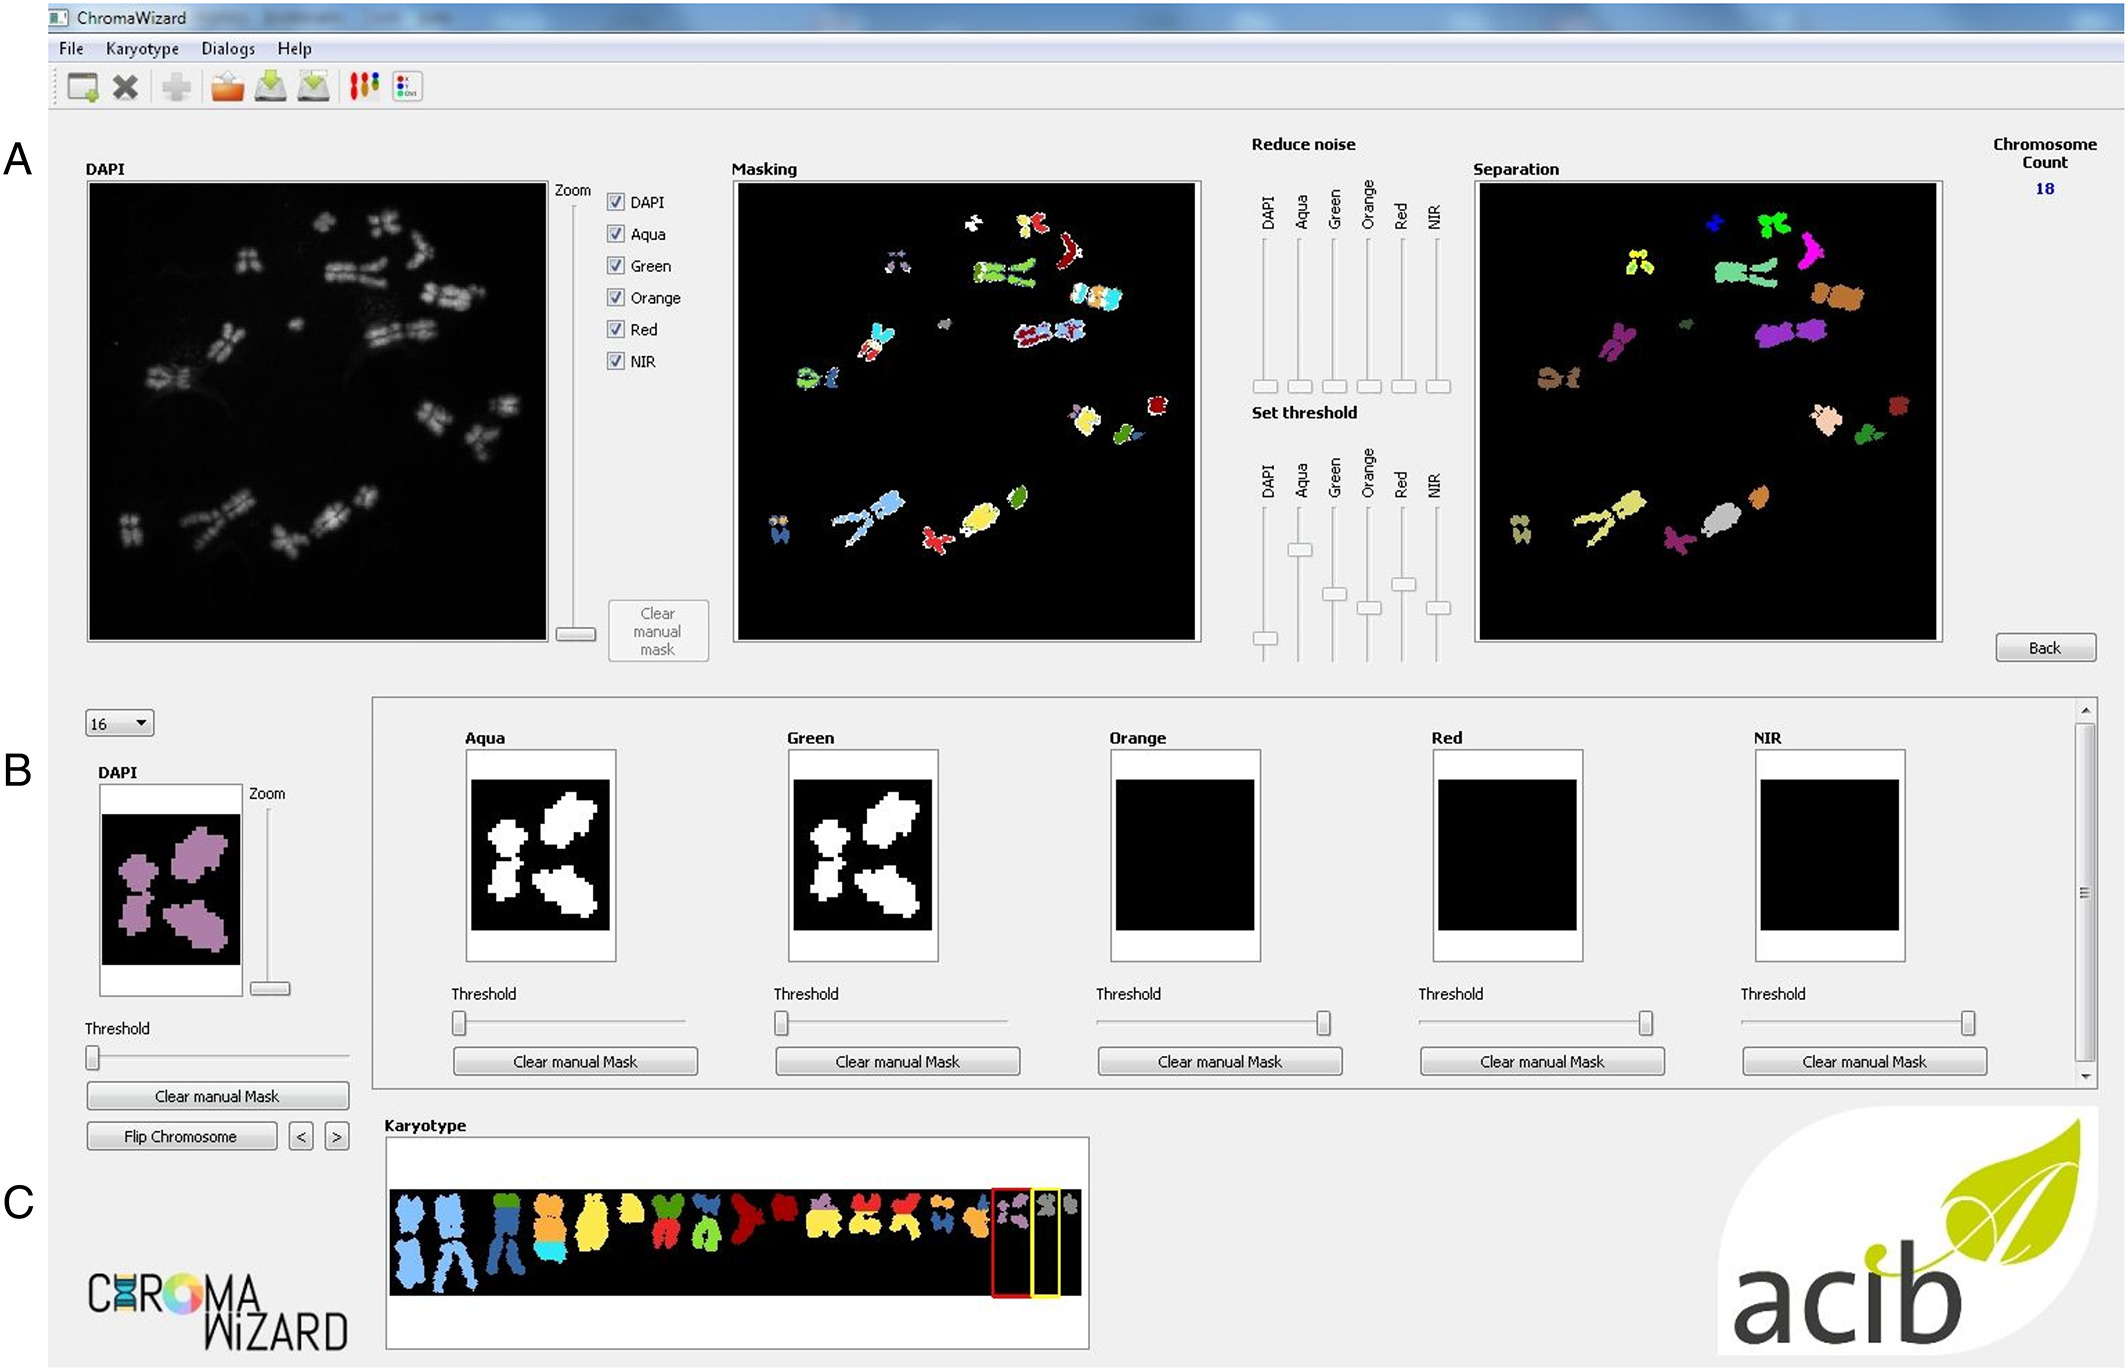
Fig. 3 Graphical user interface of ChromaWizard. Illustrations of the image, object manipulations, and visualization features. (A) Image editor: The first window shows the grayscale image of one channel selected using the check‐box provided in the upper right corner presenting all available channels. The second window displays a mask layer to remove background which will not be analyzed. White (or false colored, depending on which channels are selected) objects are selected for analysis. The user can fine-tune the mask changing default threshold and noise levels with the slider handles provided on the upper right side. Additionally the user can add or remove the mask by painting over it with the mouse or selecting an area by holding the left or right mouse button. The third window displays separated objects (according to unique individual colors) which are counted (number represented on the right upper corner). Objects can be separated by drawing a line with the mouse between them. (B) Object manipulator: Displays individual objects and their signal in all channels, thus allowing for the manipulation of mask and threshold settings at the object level. The objects are numbered by the numbers of pixel present, with the highest shown first and the lowest shown last. (C) Visualization: Displays the final output, with the false‐color assigned based on multiplexing of signals from individual channels. The user can rearrange objects by selecting and moving or rotating them. |
|---|---|
| Source |
Auer, N.; Hrdina, A.; Hiremath, C.; Vcelar, S.; Baumann, M.; Borth, N.; Jadhav, V. (2018). "ChromaWizard: An open-source image analysis software for multicolor fluorescence in situ hybridization analysis". Cytometry Part A 93 (7): 749–54. doi:10.1002/cyto.a.23505. |
| Date |
2018 |
| Author |
=Auer, N.; Hrdina, A.; Hiremath, C.; Vcelar, S.; Baumann, M.; Borth, N.; Jadhav, V. |
| Permission (Reusing this file) |
Creative Commons Attribution-NonCommercial 4.0 International |
| Other versions |
Licensing
|
|
This work is licensed under the Creative Commons Attribution-NonCommercial 4.0 International License. |
File history
Click on a date/time to view the file as it appeared at that time.
| Date/Time | Thumbnail | Dimensions | User | Comment | |
|---|---|---|---|---|---|
| current | 18:55, 30 December 2019 |  | 2,128 × 1,371 (325 KB) | Shawndouglas (talk | contribs) |
You cannot overwrite this file.
File usage
The following page uses this file:


