File:Fig5 Beaulieu-JonesJMIRMedInfo2018 6-1.png

Original file (2,400 × 1,500 pixels, file size: 330 KB, MIME type: image/png)
Summary
| Description |
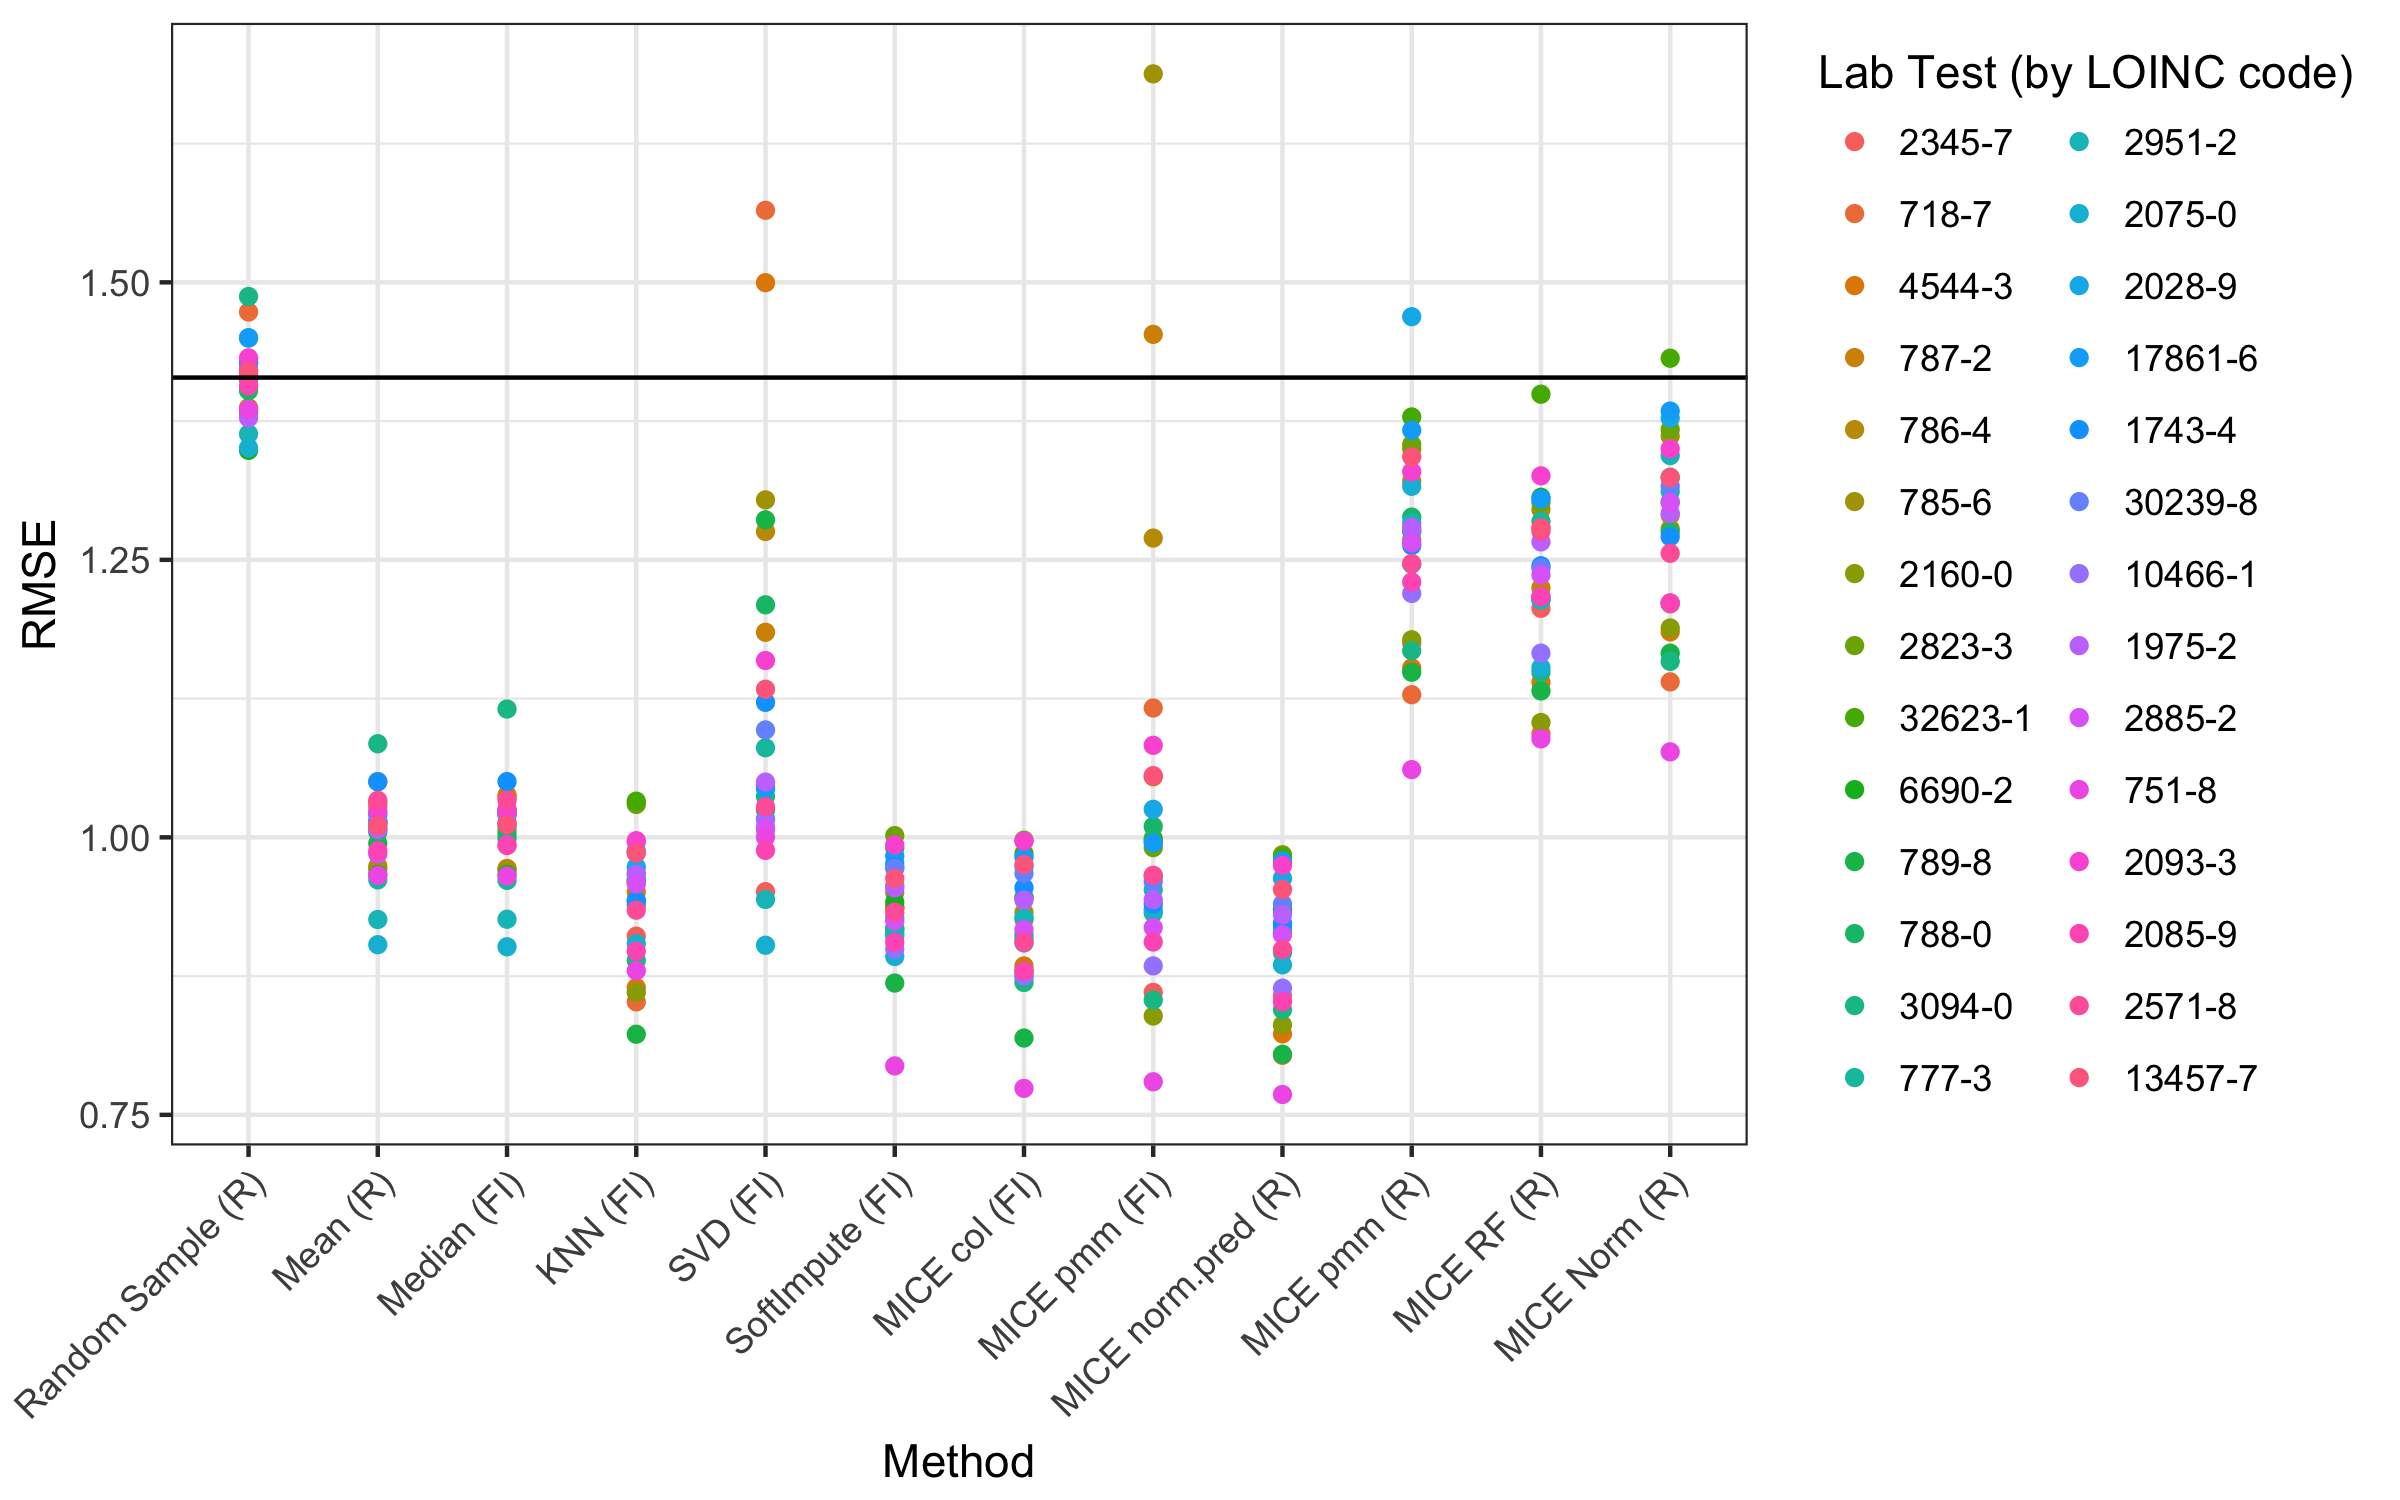
Figure 5. Imputation root mean square error (RMSE) for a subset of 10,000 patients from simulation 4. A total of 12 imputation methods were tested (x-axis), and each color corresponds to a Logical Observation Identifiers Names and Codes (LOINC) code. The black line shows the theoretical error from random sampling. FI: fancyimpute; KNN: k-nearest neighbors; MICE: Multivariate Imputation by Chained Equations; pmm: predictive mean matching; RF: random forest; SVD: singular value decomposition. |
|---|---|
| Source |
Beaulieu-Jones, B.K.; Lavage, D.R.; Snyder, J.W.; Moore, J.H.; Pendergrass, S.A.; Bauer, C.R. (2018). "Characterizing and managing missing structured data in electronic health records: Data analysis". JMIR Medical Informatics 6 (1): e11. doi:10.2196/medinform.8960. |
| Date |
2018 |
| Author |
Beaulieu-Jones, B.K.; Lavage, D.R.; Snyder, J.W.; Moore, J.H.; Pendergrass, S.A.; Bauer, C.R. |
| Permission (Reusing this file) |
|
| Other versions |
Licensing
|
|
This work is licensed under the Creative Commons Attribution 4.0 License. |
File history
Click on a date/time to view the file as it appeared at that time.
| Date/Time | Thumbnail | Dimensions | User | Comment | |
|---|---|---|---|---|---|
| current | 20:30, 6 March 2018 |  | 2,400 × 1,500 (330 KB) | Shawndouglas (talk | contribs) |
You cannot overwrite this file.
File usage
The following page uses this file:


