Journal:PathEdEx – Uncovering high-explanatory visual diagnostics heuristics using digital pathology and multiscale gaze data
| Full article title | PathEdEx – Uncovering high-explanatory visual diagnostics heuristics using digital pathology and multiscale gaze data |
|---|---|
| Journal | Journal of Pathology Informatics |
| Author(s) | Shin, Dmitriy; Kovalenko, Mikhail; Ersoy, Ilker; Li, Yu; Doll, Donald; Shyu, Chi-Ren; Hammer, Richard |
| Author affiliation(s) | University of Missouri – Columbia |
| Primary contact | Email: Available w/ login |
| Year published | 2017 |
| Volume and issue | 8 |
| Page(s) | 29 |
| DOI | 10.4103/jpi.jpi_29_17 |
| ISSN | 2153-3539 |
| Distribution license | Creative Commons Attribution-NonCommercial-ShareAlike 3.0 Unported |
| Website | http://www.jpathinformatics.org |
| Download | http://www.jpathinformatics.org/temp/JPatholInform8129-6283361_172713.pdf (PDF) |
|
|
This article should not be considered complete until this message box has been removed. This is a work in progress. |
Abstract
Background: Visual heuristics of pathology diagnosis is a largely unexplored area where reported studies only provided a qualitative insight into the subject. Uncovering and quantifying pathology visual and non-visual diagnostic patterns have great potential to improve clinical outcomes and avoid diagnostic pitfalls.
Methods: Here, we present PathEdEx, an informatics computational framework that incorporates whole-slide digital pathology imaging with multiscale gaze-tracking technology to create web-based interactive pathology educational atlases and to datamine visual and non-visual diagnostic heuristics.
Results: We demonstrate the capabilities of PathEdEx for mining visual and non-visual diagnostic heuristics using the first PathEdEx volume of a hematopathology atlas. We conducted a quantitative study on the time dynamics of zooming and panning operations utilized by experts and novices to come to the correct diagnosis. We then performed association rule mining to determine sets of diagnostic factors that consistently result in a correct diagnosis, and studied differences in diagnostic strategies across different levels of pathology expertise using Markov chain (MC) modeling and MC Monte Carlo simulations. To perform these studies, we translated raw gaze points to high-explanatory semantic labels that represent pathology diagnostic clues. Therefore, the outcome of these studies is readily transformed into narrative descriptors for direct use in pathology education and practice.
Conclusion: The PathEdEx framework can be used to capture best practices of pathology visual and non-visual diagnostic heuristics that can be passed over to the next generation of pathologists and have potential to streamline implementation of precision diagnostics in precision medicine settings.
Keywords: Digital pathology, eye tracking, gaze tracking, pathology diagnosis, visual heuristics, visual knowledge, whole slide images
Introduction
Pathology diagnosis is a highly complex process where multiple clinical and diagnostic factors have to be taken into account in an iterative fashion to produce a plausible conclusion that most accurately explains these factors from a biological standpoint.[1] Information from patient clinical history; morphological findings from microscopic evaluation of biopsies, aspirates, and smears; as well as data from flow cytometry, immunohistochemistry (IHC), and "omics" modalities such as comparative hybridization arrays and next-generation sequencing are used in the diagnostic process, which currently can be described more like a subjective exercise than a well-defined protocol. As such, it can frequently lead to diagnostic pitfalls which may harmfully impact patient case with a wrong diagnosis. The diagnostic pitfalls are most often encountered in the case of complex diseases such as cancer[2], where multiple fine-grained clinical phenotypes may require a better understanding of genomic variations across patient populations and therefore require better protocols for pathology diagnosis. It is especially important in light of realizing precision medicine ideas.[3] A better understanding of pathology diagnosis, especially of heuristics of visual reasoning over microscopic slides, is crucial to develop means for new genomic-enabled precision diagnostics methods.
Over the last decade, digital pathology (DP) and whole slide imaging (WSI) have become a mature technology that allows reproduction of the histopathologic glass slide in its entirety.[4] For the first time in the history of microscopy, diagnostic-quality digital images can be stored electronically and analyzed using computer algorithms to assist primary diagnosis and streamline research in biomedical imaging informatics.[5] This was not possible before the DP era, when cropped image areas from pathology slides could be used only to seek second opinions or share the diagnostic details with clinicians. At the same time, gaze-capturing devices have undergone transformation from bulky systems to portable, mobile trackers that can be installed on laptops and used to seamlessly collect a user's gaze.
There have been a number of research studies where WSI was used to analyze visual patterns of regions of interests (ROIs) annotated without[6][7][8][9] and with gaze-tracking technology.[10] In the former case, ROIs were identified either manually or using a viewport analysis, and in the latter case, gaze fixation points were used for the same purpose. Gaze tracking, along with mouse movement, has also been used to study pathologists' attention while viewing WSI during pathology diagnosis[11] as well as to study visual and cognitive aspects of pathology expertise.[12] The underlying idea in the majority of these studies was to analyze captured gaze data with respect to the ROIs marked in the pathology images, gaze time spent within the ROIs, and total number of fixations within the ROIs as measures of diagnostically relevant viewing behavior. However, it is challenging to use ROIs to articulate underlying biology for understanding the visual heuristics of specific diagnostic decisions. It is not trivial to encode morphological patterns of an ROI using narrative language. As such, ROI might not be an effective means to translate best practices findings from gaze-tracking studies into pathology education and pave a road toward precision diagnostics.
In this paper, we present PathEdEx, a web-based, WSI- and gaze tracking-enabled informatics framework for training and mining of visual and non-visual heuristics of pathology diagnosis. The PathEdEx system enables the development of interactive online atlases that can be used not only for educational purposes but also have the potential of capturing best diagnostic strategies and representing them in a highly explanatory format for pathology practice. We demonstrate the capabilities of PathEdEx for mining visual and non-visual diagnostic heuristics by 1. performing quantitative studies on the time dynamics of zooming and panning operations utilized by experts and novices to come to a correct diagnosis, 2. scanning association rule (AR) mining[13] studies to determine sets of diagnostic factors that consistently result in a correct diagnosis, and 3. quantifying differences in diagnostic strategies across different levels of pathology expertise using Markov chain (MC) modeling[14][15] and MC Monte Carlo (MCMC) simulations.[16][17] These studies allowed us to understand effective and efficient practices of human diagnostic heuristics that can be passed over to the next generation of pathologists and streamline implementation of precision diagnostics in precision medicine settings. The studies are performed using the first PathEdEx interactive training atlas of hematopathological cancers.
Methods
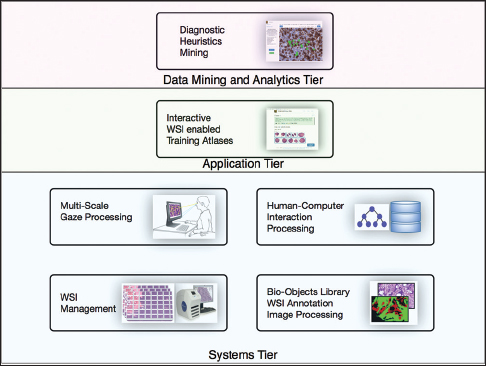
Each PathEdEx training atlas is a web-based system and runs inside a browser window as a thin client in an in-house developed multi-tiered informatics ecosystem, depicted in Figure 1. The systems tier represents a foundation of PathEdEx, containing essential software modules for processing of imaging and non-imaging data.
|
Whole slide imaging management module
This module is responsible for processing of WSIs. The client side of this module is implemented in JavaScript using Bootstrap[18] and jQuery[19] libraries, and the WSI online viewer is based on the OpenSeaDragon JavaScript library[20] that enables the interactive viewing of large WSIs over the internet. At the server side, WSIs are served by IIPImage server, which is an open-source tiled image server.[21] The WSI images of the patient cases are obtained by scanning the slides with the Aperio ScanScope CS (Leica Biosystems)[22] slide scanner at × 40, and they are converted to tiled pyramid TIFF images using the open-source VIPS library.[23] Each TIFF image contains 256 × 256 pixel tiles of the slide at seven different zoom levels. This enables the efficient communication of the whole slide data since only the visible part of the WSI is served to the client at any time. The WSI online viewer allows users to zoom and pan the image to provide a virtual microscope experience.
The multiscale gaze processing module
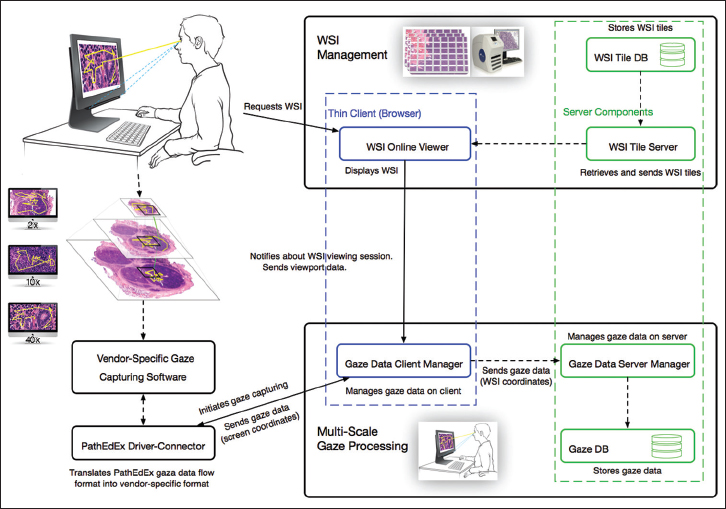
This module is responsible for the capturing and processing of gaze data. The module consists of the gaze data server manager that works on the server side, the gaze data client manager that works on the client side inside of a browser, and the driver-connector that provides connectivity to gaze capturing software supplied by a gaze tracker manufacturer. The data exchange occurs between the WSI online viewer, gaze data server manager, and the gaze data client manager, and the driver-connector is implemented using web sockets technology. This enables a fast and real-time communication. When a user starts viewing a WSI, the gaze data client manager is notified by WSI online viewer (blue-dotted section in Figure 2) about a WSI viewing session and sends a request to the driver-connector that in turn communicates with a vendor-specific gaze capturing software to start collecting gaze data (left side of Figure 2). The collected data flow back through driver-connector to the gaze data client manager. The gaze data client manager uses viewport data from the WSI online viewer, including viewport position, zooming, panning, and mouse position information, to compute in real-time the coordinates of each gaze point relative to the origin of the WSI and sends them to the gaze data server manager (bottom of Figure 2). The gaze data server manager saves the coordinates in a database for further processing and analysis.
|
Human-computer interaction processing module
This module of the PathEdEx systems tier provides functionality for managing user sessions for specific applications. On the basic level, it provides authentication and authorization functionality for PathEdEx users and groups. On the higher level, this module manages data related to various diagnostic algorithms as well as users' navigational data as they use PathEdEx resources like WSI. PathEdEx provides a set of software tools with a graphical user interface to help pathology experts define reference diagnostic algorithms for different types of cases. These algorithms, as well as users' PathEdEx navigational data, are stored in the form of graphs in a Neo4J database, which has superior capabilities for structured queries over relational databases.[24]
Bio-objects library, whole slide imaging annotation, and image processing module
This module is responsible for capturing and storing information about microanatomical structures on histopathological WSIs. For instance, different types of cells and tissues are treated as "biological objects" by the PathEdEx system and stored in the form of WSI annotations. At present, the majority of such bio-objects are defined semi-automatically by experts using in-house developed software tools. However, work is underway to use advanced WSI image processing algorithms to aid WSI annotation. For instance, we have been developing novel methods for follicle and nucleus detection on WSI[25][26] and plan on incorporating these algorithms into the PathEdEx ecosystem.
Interactive whole slide imaging-enabled training atlases
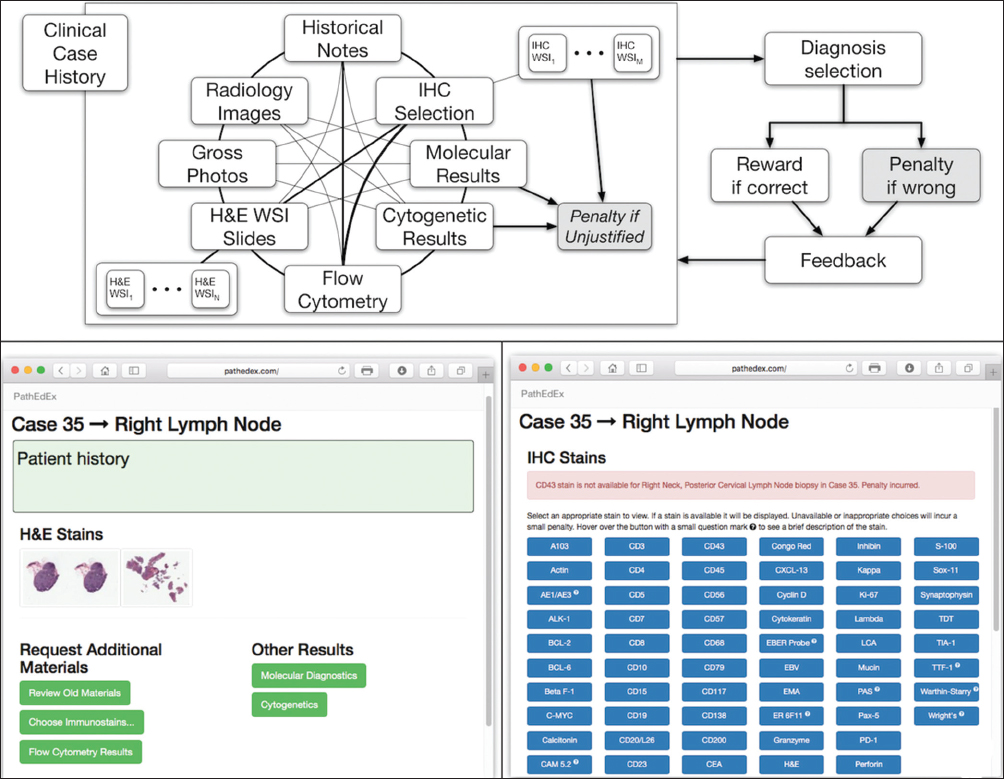
The application tier of the PathEdEx informatics ecosystem (middle panel in Figure 1) represents interactive, WSI-enabled pathology atlases that assist pathology trainees in learning various pathology subspecialty areas using a simulated WSI-rich diagnostic environment. Here, we present the first such PathEdEx Atlas that consists of 55 patient cases of hematopathological cancers from the University of Missouri Ellis Fischel Cancer Center. Each case includes a complete set of information such as clinical notes, radiological imaging studies, WSI of histopathology slides, IHC, and molecular tests as well as any additional laboratory data that are available for the case. For each patient case, PathEdEx includes a reference diagnostic workflow that is defined by an expert hematopathologist. The trainee reviews images and makes decisions upon selection of additional tests. Any unjustified selection of a test in PathEdEx is penalized by a negative score, which reflects the dollar amount of the corresponding test. For instance, if after reviewing morphological aspects of a hematoxylin and eosin (H and E) WSI slide, a trainee decides to view a specific IHC WSI slide but that IHC test is considered to be irrelevant to the case, he or she will receive a penalty. Every attempt to diagnose similar cases is logged and the overall progress of a trainee during a period is reported along with a detailed analysis of the diagnostics decisions. The trainee's diagnostic workflow is then stored for analysis and progress assessment purposes. An example of a trainee's diagnostic workflow is presented in Figure 3.
|
Diagnostic heuristic mining module
This module of PathEdEx's data mining and analytics tier is responsible for the essential functionality that supports diagnostic heuristic mining studies. Specifically, it provides data structures and representational models for manipulation and quantification of visual and non-visual diagnostic entities. To do that, PathEdEx introduces a number of novel informatics approaches. Unlike ROI-based gaze tracking studies that are based on low-level, pixel-based features, mining of visual diagnostic heuristics in PathEdEx is based on high-level, semantic labels that represent visual diagnostic clues (VDC) related to biological entities such as type of cells (e.g., centroblasts, Reed–Sternberg cells) and diagnostics factors (e.g., mitotic rate). Therefore, the results of heuristics mining in PathEdEx are much easier for understanding by a human expert and for drawing quantitative conclusions about most impactful factors that lead to correct diagnosis. The annotation of gaze data with semantic labels is done on a semiautomatic fashion and is followed by a fully computerized processing of visual and non-visual heuristics analytics. Because VDCs play a central role in the mining of pathology diagnostic heuristics, we describe it here in greater detail.
The human eye goes through a series of fixation points and saccades during processing of a visual scene. Since the human ability to discriminate fine detail drops off outside of the fovea, eye movements help process the visual field through a series of fixation points separated by saccades (the actual eye movement) from one fixation point to other. The typical mean duration of fixation is about 180–275 ms.[27] The vision is suppressed during the saccade, and visual information is acquired during the fixation. Hence, a procedure to compute fixation points is required to analyze the collected eye gaze data. In case of histopathologic images, these fixation points can be grouped into visual diagnostic focus areas (VDFAs) and annotated. That way instead of an analysis of "low-level individual" fixation points, a more biologically relevant analysis of possibly diagnostically relevant VDFAs can be performed. Unlike commercial off-the-shelf fixation point algorithms, the PathEdEx's VDFA algorithms are specifically designed to take into account morphological structures of histopathologic sections. We have been developing a number of novel algorithms that are designed to identify and annotate VDFAs on histopathologic images such as tissue-, cell-, and sub-cellular level microanatomical structures of different morphology. However, in the context of this paper, we describe only one such method, based on mean shift clustering.
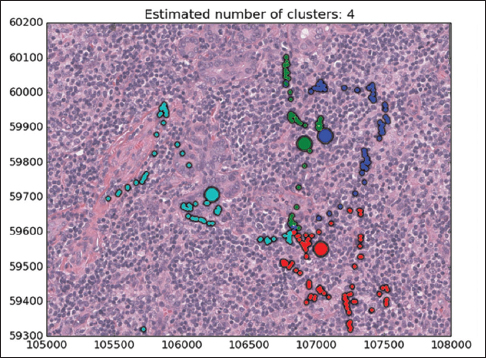
Mean shift algorithm is a non-parametric clustering technique that does not require prior knowledge of the number of clusters and does not constrain the shape of the clusters. Mean shift considers the set of points as discrete samples from an underlying probability density function. For each data point, mean shift defines a window around it and computes the mean of the data point. Then, it shifts the center of the window to the mean and repeats the algorithm until convergence. The set of all locations that converge to the same mode defines the basin of attraction of that mode. The points that are in the same basin of attraction are associated with the same cluster. Hence, the mean shift clustering algorithm is a practical application of the mode finding procedure. Since mean shift does not make assumptions about the number of clusters, it can find naturally occurring clusters in the data. Mean shift clustering requires a bandwidth parameter that defines the scale of clusters. Smaller bandwidth leads to a larger number of smaller scale clusters whereas larger bandwidth leads to a smaller number of larger scale clusters. We represent the collected eye gaze data associated with a WSI slide as a set of four-dimensional points (x, y, z, t) where dimensions correspond to coordinates of the eye gaze (x, y) and zoom level of the slide (z) at time (t). Sets of points are separated by zoom levels, and clusters are found at each zoom level. The cluster centers (modes) represent the fixation points of a user's eye. Discovered in this fashion, clusters will correspond to VDFAs, which are then annotated in a semiautomatic setting. An example of the result of identification of VDFAs is shown in Figure 4. The VDFAs are then annotated during a diagnostic heuristic mining study to represent VDCs, as will be demonstrated in the results and discussion section.
|
Results and discussion
Mining visual and non-visual diagnostic heuristics
We have conducted three data mining studies of visual and non-visual diagnostic heuristics. The main purpose of these studies was to test the capabilities of the PathEdEx informatics framework. We were not focused on comprehensiveness of the studies' setup and the scientific validity of the results and conclusions. Instead, we aimed to demonstrate the utility of the PathEdEx as a framework to uncover and quantify pathology diagnostic heuristics with highly explanatory results over a complete set of diagnostic materials from real patient cases, which, to the best of our knowledge, has not been previously reported.
Study 1: Quantification of diagnostic workflow
A total of nine users navigated through four selected cases in the developed PathEdEx online atlas of hematopathology cases. The users were given numerical ranks to indicate their level of experience, starting with rank one for expert pathologist up to rank six for post-sophomore fellows (PSFs). They were also sorted into three groups of three users for a less granular ranking. Table 1 shows the distribution of experience levels and their ranks.
|
Their navigation and gaze data were collected as described in the methods section. The selected four patient cases had a total of 29 WSIs of H and E and IHC slides. Since each user was free to order a different number of IHC tests as they deemed necessary, not every user went through all 29 images. The total number of image views was 149, averaging about 16 WSI views per user. The collected gaze data were analyzed using PathEdEx's diagnostic heuristic mining module. Gaze data for each image were first separated by their corresponding zoom levels, and then, the mean shift algorithm was applied to gaze data at each zoom level to compute fixation points. A set of 17 features that had the potential to capture viewing behavior was computed for each user and each WSI using the collected and computed data. The computed features were as follows:
- 1 - Number of zoom levels with user's fixations in the image
- 2 - Number of fixation points in the image
- 3 - View time of the image
- 4 - Total duration of fixations in the image
- 5 - Mean zoom level in the image weighted by number of fixations
- 6 - Total distance of eye gaze scan in the whole image
- 7 - Total distance of eye gaze scan within fixation clusters
- 8 - Focus ratio: Total distance (6) divided by end to end gaze distance in the image
- 9 - Dispersion: Within-fixation distance (7) divided by total distance (6)
- 10 - End-to-end gaze distance in the image
- 11 - Dispersion: Average of dispersions computed at each separate zoom level
- 12 - Mean zoom level (over viewing time) of the image
- 13 - Standard deviation of zoom level (over viewing time) of the image
- 14–17 - Means and standard deviations of zoom level differences in time with and without zeroes
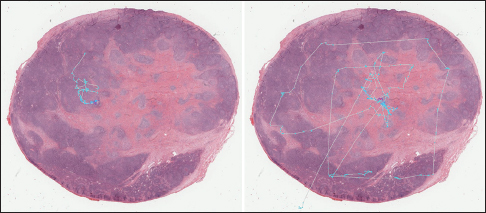
Figure 5 shows an example of eye gaze data superposed on a WSI. Since users can pan and zoom, the trajectory of the eye gaze represents all zoom levels converted to the global image coordinates.
|
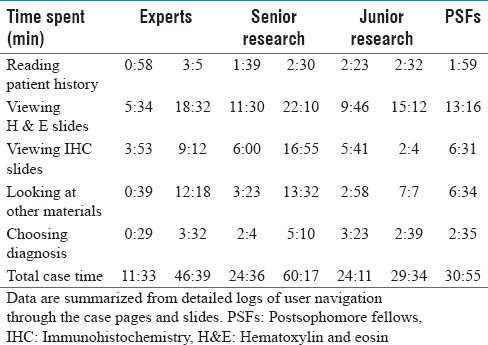
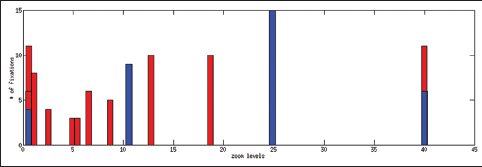
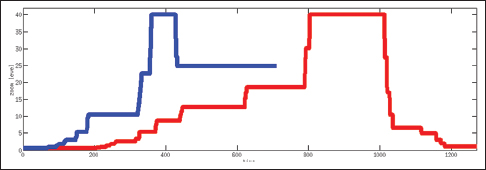
Table 2 shows the total time spent on different aspects of the cases while Figure 6 presents a comparison between an expert and a PSF in terms of the distribution of the fixation points among zoom levels. A PSF navigates through a variety of zoom levels whereas the expert spends time concentrated on a small number of zoom levels. Figure 7 shows the zoom levels as a function of time for the same users.
|
|
|
References
- ↑ Shin, D.; Arthur, G.; Caldwell, C. et al. (2012). "A pathologist-in-the-loop IHC antibody test selection using the entropy-based probabilistic method". Journal of Pathology Informatics 3: 1. doi:10.4103/2153-3539.93393. PMC PMC3307231. PMID 22439121. https://www.ncbi.nlm.nih.gov/pmc/articles/PMC3307231.
- ↑ Higgins, R.A.; Blankenship, J.E.; Kinney, M.C. (2008). "Application of immunohistochemistry in the diagnosis of non-Hodgkin and Hodgkin lymphoma". Archives of Pathology & Laboratory Medicine 132 (3): 441-61. doi:10.1043/1543-2165(2008)132[441:AOIITD]2.0.CO;2. PMID 18318586.
- ↑ Tenenbaum, J.D.; Avillach, P.; Benham-Hutchins, M. et al. (2016). "An informatics research agenda to support precision medicine: Seven key areas". JAMIA 23 (4): 791-5. doi:10.1093/jamia/ocv213. PMC PMC4926738. PMID 27107452. https://www.ncbi.nlm.nih.gov/pmc/articles/PMC4926738.
- ↑ Pantanowitz, L. (2010). "Digital images and the future of digital pathology". Journal of Pathology Informatics 1: 15. doi:10.4103/2153-3539.68332. PMC PMC2941968. PMID 20922032. https://www.ncbi.nlm.nih.gov/pmc/articles/PMC2941968.
- ↑ Chen, Z.; Shin, D.; Chen, S. et al. (2014). "Histological quantitation of brain injury using whole slide imaging: A pilot validation study in mice". PLOS One 9 (3): e92133. doi:10.1371/journal.pone.0092133. PMC PMC3956884. PMID 24637518. https://www.ncbi.nlm.nih.gov/pmc/articles/PMC3956884.
- ↑ Reder, N.P.; Glasser, D.; Dintzis, S.M. et al. (2016). "NDER: A novel web application using annotated whole slide images for rapid improvements in human pattern recognition". Journal of Pathology Informatics 7: 31. doi:10.4103/2153-3539.186913. PMC PMC4977980. PMID 27563490. https://www.ncbi.nlm.nih.gov/pmc/articles/PMC4977980.
- ↑ Mercan, E.; Aksoy, S.; Shapiro, L.G. et al. (2016). "Localization of Diagnostically Relevant Regions of Interest in Whole Slide Images: A Comparative Study". Journal of Digital Imaging 29 (4): 496-506. doi:10.1007/s10278-016-9873-1. PMC PMC4942394. PMID 26961982. https://www.ncbi.nlm.nih.gov/pmc/articles/PMC4942394.
- ↑ Mercan, C.; Mercan, E.; Aksoy, S. et al. (2016). "Multi-instance multi-label learning for whole slide breast histopathology". SPIE Proceedings 9791: 979108. doi:10.1117/12.2216458.
- ↑ Roa-Peña, L.; Gómez, F.; Romero, E. (2010). "An experimental study of pathologist's navigation patterns in virtual microscopy". Diagnostic Pathology 5: 71. doi:10.1186/1746-1596-5-71. PMC PMC3001424. PMID 21087502. https://www.ncbi.nlm.nih.gov/pmc/articles/PMC3001424.
- ↑ Brunyé,T.T.; Carney, P.A.; Allison, K.H. et al. (2014). "Eye movements as an index of pathologist visual expertise: A pilot study". PLOS One 9 (8): e103447. doi:10.1371/journal.pone.0103447. PMC PMC4118873. PMID 25084012. https://www.ncbi.nlm.nih.gov/pmc/articles/PMC4118873.
- ↑ Raghunath, V.; Braxton, M.O.; Gagnon, S.A. et al. (2012). "Mouse cursor movement and eye tracking data as an indicator of pathologists' attention when viewing digital whole slide images". Journal of Pathology Informatics 3: 43. doi:10.4103/2153-3539.104905. PMC PMC3551530. PMID 23372984. https://www.ncbi.nlm.nih.gov/pmc/articles/PMC3551530.
- ↑ Jaarsma, T; Jarodzka, H.; Nap, M. et al. (2015). "Expertise in clinical pathology: combining the visual and cognitive perspective". Journal of Pathology Informatics 20 (4): 1089-106. doi:10.1007/s10459-015-9589-x. PMC PMC4564442. PMID 25677013. https://www.ncbi.nlm.nih.gov/pmc/articles/PMC4564442.
- ↑ Agrawal, R.; Imieliński, T.; Swami, A. (1993). "Mining association rules between sets of items in large databases". ACM SIGMOD Record 22 (2): 207–216. doi:10.1145/170036.170072.
- ↑ Markov, A. (2007). "Appendix B: Extension of the Limit Theorems of Probability Theory to a Sum of Variables Connected in a Chain". In Howard, R.A.. Dynamic Probabilistic Systems, Volume I: Markov Models. Dover Publications. pp. 551–576. ISBN 9780486458700.
- ↑ Markov, A. (1971). "Extension of the Limit Theorems of Probability Theory to a Sum of Variables Connected in a Chain". In Howard, R.A.. Dynamic Probabilistic Systems, Volume I: Markov Models. John Wiley & Sons, Inc. pp. 552–577. ISBN 9780471416654.
- ↑ Metropolis, N.; Rosenbluth, A.W.; Rosenbluth, M.N. et al. (1953). "Equation of State Calculations by Fast Computing Machines". The Journal of Chemical Physics 21: 1087–1092. doi:10.1063/1.1699114.
- ↑ Robert, C.; Casella, G. (2011). "A Short History of Markov Chain Monte Carlo: Subjective Recollections from Incomplete Data". Statistical Science 26 (1): 102–115. doi:10.1214/10-STS351.
- ↑ Otto, M.; Thornton, J.. "Bootstrap". http://getbootstrap.com/. Retrieved 23 June 2017.
- ↑ "jQuery". jQuery Foundation. http://jquery.com/. Retrieved 23 June 2017.
- ↑ OpenSeadragon contributors. "Open Seadragon". CodePlex Foundation. https://openseadragon.github.io/. Retrieved 23 June 2017.
- ↑ Pillay, R.. "IIPImage". Slashdot Media. http://iipimage.sourceforge.net/. Retrieved 23 June 2017.
- ↑ "Leica Biosystems". Leica Biosystems Nussloch GmbH. http://www.leicabiosystems.com/. Retrieved 23 June 2017.
- ↑ Cupitt, J.; Martinez, K.; Padfield, J.. "VIPS". http://www.vips.ecs.soton.ac.uk/index.php?title=VIPS. Retrieved 23 June 2017.
- ↑ Vicknair, C.; Macias, M.; Zhao, Z. et al. (2010). "A comparison of a graph database and a relational database: A data provenance perspective". Proceedings of the 48th Annual Southeast Regional ACM Conference: 42. doi:10.1145/1900008.1900067.
- ↑ Han, J.; Shin, D.V.; Arthur, G.L. et al. (2010). "Multi-resolution tile-based follicle detection using color and textural information of follicular lymphoma IHC slides". 2010 IEEE International Conference on Bioinformatics and Biomedicine Workshops (BIBMW): 866-7. doi:10.1109/BIBMW.2010.5703949.
- ↑ Alzubaidi, L.; Ersoy, I.; Shin, D. et al. (2016). "Nucleus Detection in H&E Images with Fully Convolutional Regression Networks". Proceedings from the First International Workshop on Deep Learning for Pattern Recognition (DLPR), 2016. http://cell.missouri.edu/publications/264/.
- ↑ Findlay, J.M.; Gilchrist, I.D. (2003). Active Vision: The Psychology of Looking and Seeing. Oxford University Press. p. 240. ISBN 9780198524793.
Notes
This presentation is faithful to the original, with only a few minor changes to presentation and updates to spelling and grammar. In some cases important information was missing from the references, and that information was added.
