File:Fig4 Khan BMCBioinformatics2017 18.gif
From LIMSWiki

Size of this preview: 603 × 599 pixels. Other resolution: 779 × 774 pixels.
Original file (779 × 774 pixels, file size: 176 KB, MIME type: image/gif)
Summary
| Description |
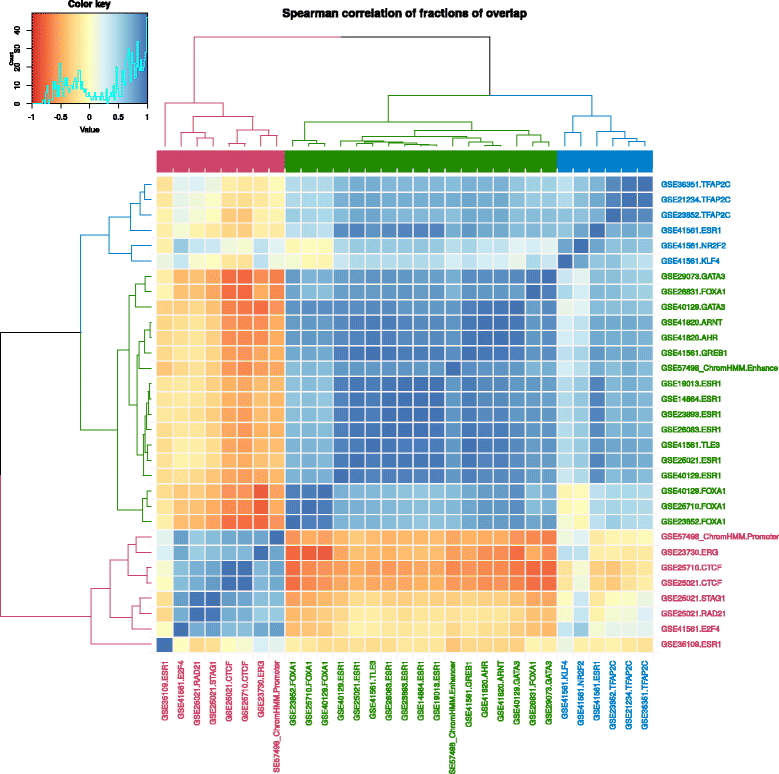
Figure 4. MCF-7 cluster heat map. Cluster heat map of the Spearman correlations of fractions of overlap between TF ChIP-seq data sets and regulatory regions in MCF-7. Three clusters (red, green, and blue) are highlighted. |
|---|---|
| Source |
Khan, A.; Mathelier, A. (2017). "Intervene: A tool for intersection and visualization of multiple gene or genomic region sets". BMC Bioinformatics 18: 287. doi:10.1186/s12859-017-1708-7. |
| Date |
2017 |
| Author |
Khan, A.; Mathelier, A. |
| Permission (Reusing this file) |
|
| Other versions |
Licensing
|
|
This work is licensed under the Creative Commons Attribution 4.0 License. |
File history
Click on a date/time to view the file as it appeared at that time.
| Date/Time | Thumbnail | Dimensions | User | Comment | |
|---|---|---|---|---|---|
| current | 22:15, 6 June 2017 |  | 779 × 774 (176 KB) | Shawndouglas (talk | contribs) |
You cannot overwrite this file.
File usage
The following page uses this file:


