File:Fig5 Ye JofPathInformatics2016 7.jpg
From LIMSWiki
Fig5_Ye_JofPathInformatics2016_7.jpg (514 × 497 pixels, file size: 51 KB, MIME type: image/jpeg)
Summary
| Description |
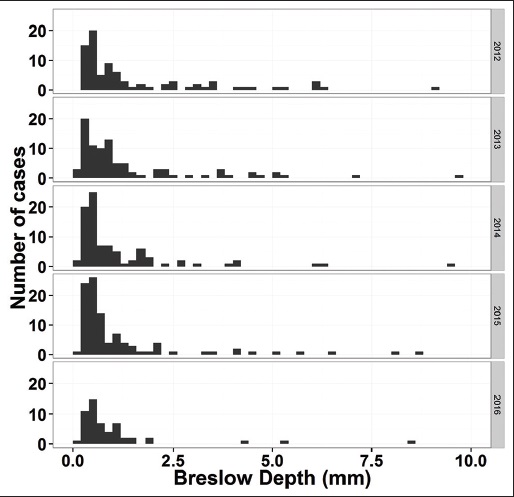
Figure 5. Distribution of Breslow depth of melanoma of skin grouped by year. This graph is made using data in the column named "BreslowDepth (mm)," and the data are grouped by the year when the surgical procedure was performed. |
|---|---|
| Source |
Ye, J.J. (2016). "Pathology report data extraction from relational database using R, with extraction from reports on melanoma of skin as an example". Journal of Pathology Informatics 7: 44. doi:10.4103/2153-3539.192822. |
| Date |
2016 |
| Author |
Ye, J.J. |
| Permission (Reusing this file) |
Creative Commons Attribution-NonCommercial-ShareAlike 3.0 Unported |
| Other versions |
Licensing
|
|
This work is licensed under the Creative Commons Attribution-NonCommercial-ShareAlike 3.0 Unported License. |
File history
Click on a date/time to view the file as it appeared at that time.
| Date/Time | Thumbnail | Dimensions | User | Comment | |
|---|---|---|---|---|---|
| current | 22:48, 16 November 2016 |  | 514 × 497 (51 KB) | Shawndouglas (talk | contribs) |
You cannot overwrite this file.


