Difference between revisions of "File:Fig15 Sutton SmartAgTech2023 3.jpg"
Shawndouglas (talk | contribs) m (2 revisions imported) |
Shawndouglas (talk | contribs) (Shawndouglas uploaded File:Fig15 Sutton SmartAgTech2023 3.jpg) |
(No difference)
| |
Latest revision as of 21:28, 26 December 2023
Summary
| Description |
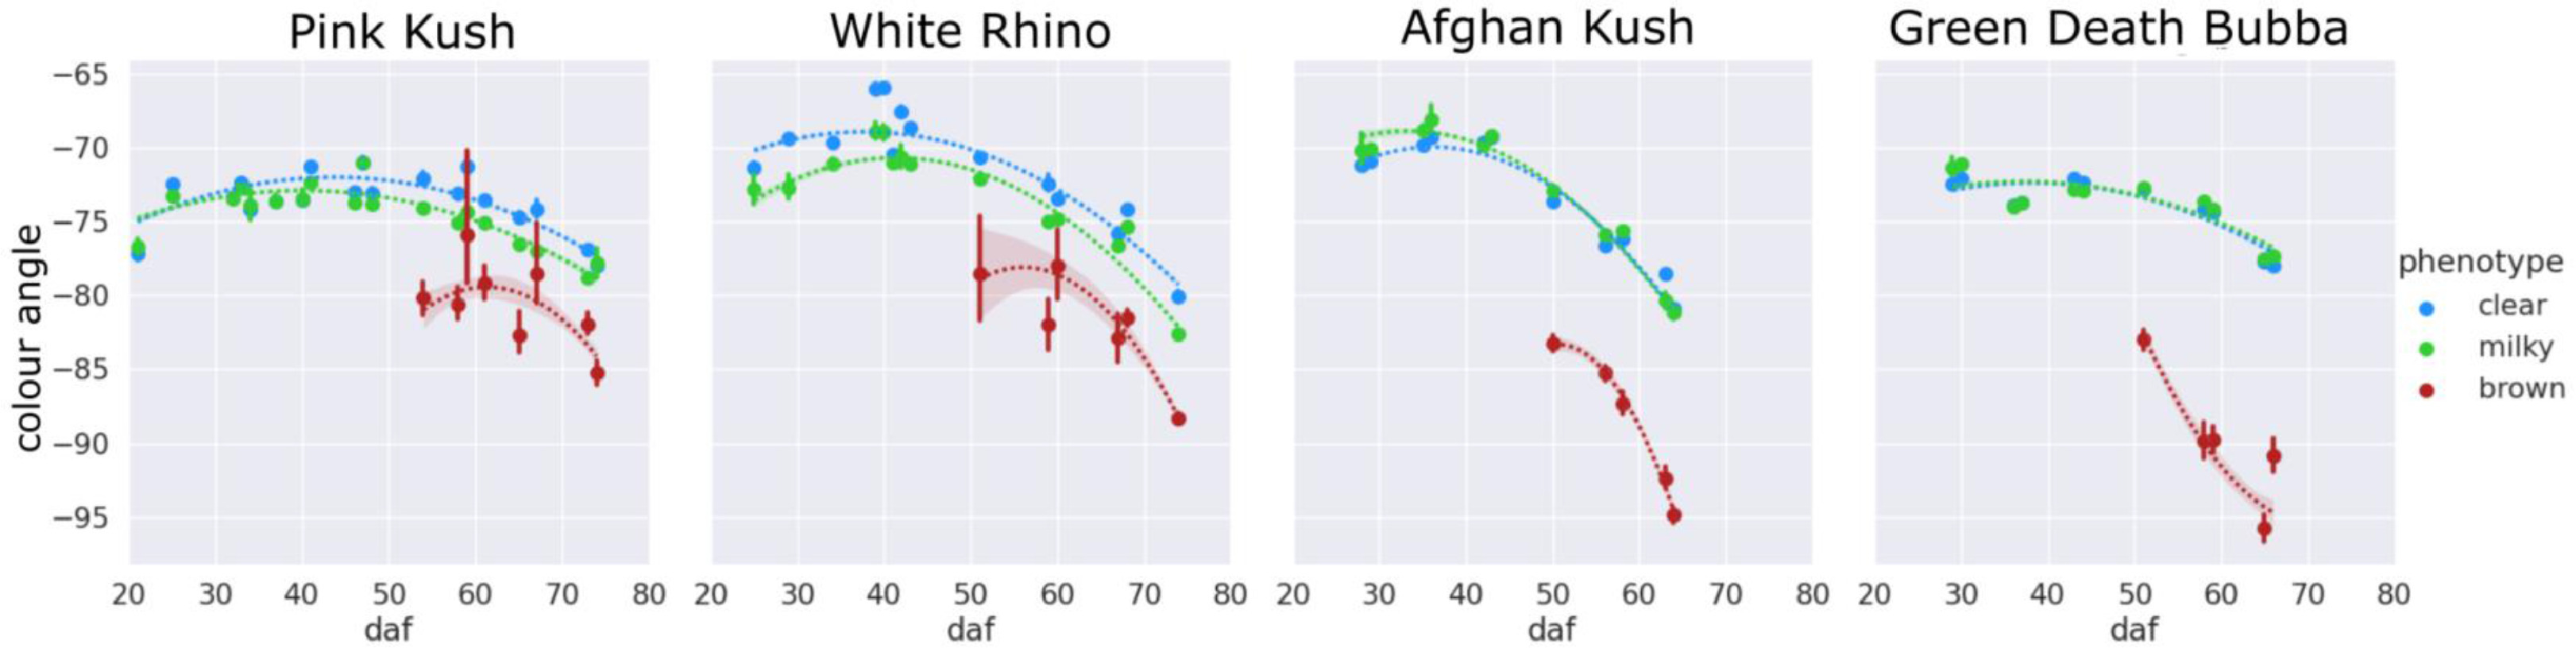
Fig. 15 Color figure of trichome gland head fluorescence. The CIELAB color angle describing fluorescence spectra of for all trichome gland heads observed over the flowering period. Points represent the mean of all trichomes observed at the specified flowering time, with standard error bars representing the standard deviation of the mean. Second order regression lines fitted to each phenotype display 95% confidence intervals as transparent bands. |
|---|---|
| Source |
Sutton, D.B.; Punja, Z.K.; Hamarneh, G. (2023). "Characterization of trichome phenotypes to assess maturation and flower development in Cannabis sativa L. (cannabis) by automatic trichome gland analysis". Smart Agricultural Technology 3: 100111. doi:10.1016/j.atech.2022.100111. |
| Date |
2023 |
| Author |
Sutton, D.B.; Punja, Z.K.; Hamarneh, G. |
| Permission (Reusing this file) |
Creative Commons Attribution-NonCommercial-NoDerivatives 4.0 International |
| Other versions |
Licensing
|
|
This work is licensed under the Creative Commons Attribution-NonCommercial-NoDerivatives 4.0 International License. |
File history
Click on a date/time to view the file as it appeared at that time.
| Date/Time | Thumbnail | Dimensions | User | Comment | |
|---|---|---|---|---|---|
| current | 21:28, 26 December 2023 | 3,243 × 816 (265 KB) | Shawndouglas (talk | contribs) |
You cannot overwrite this file.
File usage
The following page uses this file:


