Difference between revisions of "File:Fig6 Jikomes SciReports2018 8.jpg"
Shawndouglas (talk | contribs) ({{Information |Description='''Figure 6.''' Total THC and CBD Levels Across Popular Consumer Strain Categories for Flower Products. '''(a)''' Distribution of THC levels across popular strain categories for chemotype I flower and '''(b)''' effect size ma...) |
Shawndouglas (talk | contribs) m (2 revisions imported) |
Latest revision as of 22:47, 20 December 2023
Summary
| Description |
Figure 6. Total THC and CBD Levels Across Popular Consumer Strain Categories for Flower Products. (a) Distribution of THC levels across popular strain categories for chemotype I flower and (b) effect size matrix quantifying the magnitude of differences between them. (c) Distribution of CBD levels across the same categories for chemotype II and III flower and (d) effect size matrix quantifying the magnitude of differences between them. |
|---|---|
| Source |
Jikomes, N.; Zoorob, M. (2018). "The cannabinoid content of legal cannabis in Washington State varies systematically across testing facilities and popular consumer products". Scientific Reports 8: 4519. doi:10.1038/s41598-018-22755-2. |
| Date |
2018 |
| Author |
Jikomes, N.; Zoorob, M. |
| Permission (Reusing this file) |
|
| Other versions |
Licensing
|
|
This work is licensed under the Creative Commons Attribution 4.0 License. |
File history
Click on a date/time to view the file as it appeared at that time.
| Date/Time | Thumbnail | Dimensions | User | Comment | |
|---|---|---|---|---|---|
| current | 21:34, 5 April 2019 | 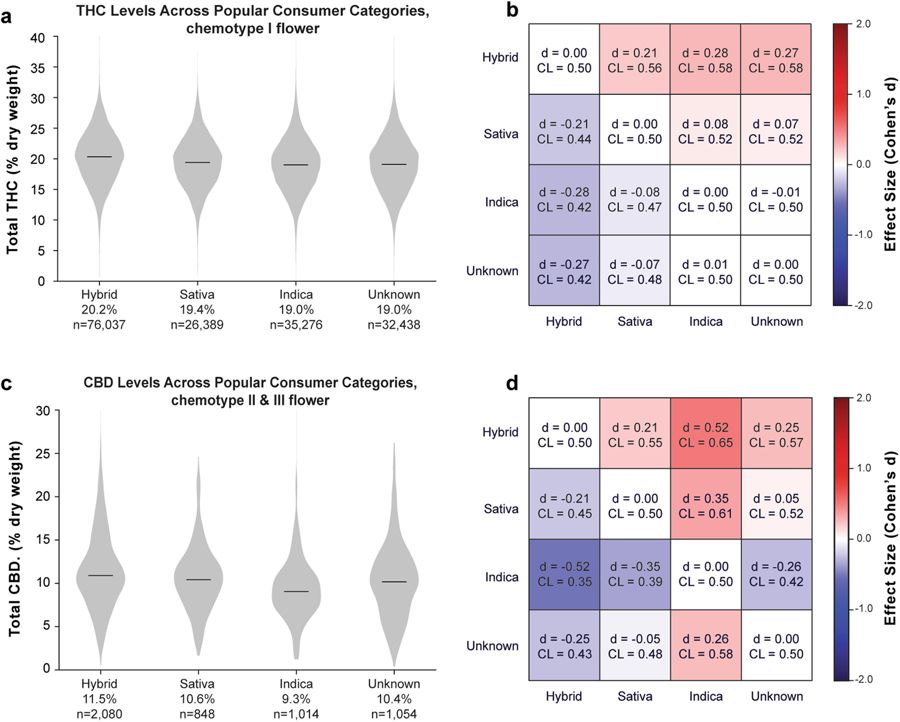 | 900 × 722 (82 KB) | Shawndouglas (talk | contribs) | {{Information |Description='''Figure 6.''' Total THC and CBD Levels Across Popular Consumer Strain Categories for Flower Products. '''(a)''' Distribution of THC levels across popular strain categories for chemotype I flower and '''(b)''' effect size ma... |
You cannot overwrite this file.


