Difference between revisions of "File:Fig8 Jikomes SciReports2018 8.jpg"
Shawndouglas (talk | contribs) (Added summary) |
Shawndouglas (talk | contribs) ({{Information |Description='''Figure 8.''' Popular Strain Names as Signal for THC and CBD Content. '''(a)''' Proportion of variation in log10 THC:CBD ratio explained by popular strain names (Intraclass Correlation Coefficient). 99% CIs are shown, by la...) |
||
| Line 1: | Line 1: | ||
==Summary== | == Summary == | ||
{{Information | {{Information | ||
|Description='''Figure 8.''' Popular Strain Names as Signal for THC and CBD Content. '''(a)''' Proportion of variation in log10 THC:CBD ratio explained by popular strain names (Intraclass Correlation Coefficient). 99% CIs are shown, by lab, before (black circles) and after (gray squares) filtering test results by the modal chemotype of each strain name. The ICC is shown both for dropping values for which 0% CBD or 0% THC is reported (left) and coercing cannabinoid ratios for these tests (see Methods). '''(b)''' Mean THC level of popular chemotype I strains. 99% CIs are shown after filtering by modal chemotype, for the lab reporting the lowest THC levels. '''(c)''' Mean CBD levels for popular chemotype II (above dotted line) and chemotype III (below dotted line) strain names. Results shown for the lab reporting the lowest mean THC levels. |Source={{cite journal |title=The cannabinoid content of legal cannabis in Washington State varies systematically across testing facilities and popular consumer products |journal=Scientific Reports |author=Jikomes, N.; Zoorob, M. |volume=8 |pages=4519 |year=2018 |doi=10.1038/s41598-018-22755-2}} | |Description='''Figure 8.''' Popular Strain Names as Signal for THC and CBD Content. '''(a)''' Proportion of variation in log10 THC:CBD ratio explained by popular strain names (Intraclass Correlation Coefficient). 99% CIs are shown, by lab, before (black circles) and after (gray squares) filtering test results by the modal chemotype of each strain name. The ICC is shown both for dropping values for which 0% CBD or 0% THC is reported (left) and coercing cannabinoid ratios for these tests (see Methods). '''(b)''' Mean THC level of popular chemotype I strains. 99% CIs are shown after filtering by modal chemotype, for the lab reporting the lowest THC levels. '''(c)''' Mean CBD levels for popular chemotype II (above dotted line) and chemotype III (below dotted line) strain names. Results shown for the lab reporting the lowest mean THC levels. |Source={{cite journal |title=The cannabinoid content of legal cannabis in Washington State varies systematically across testing facilities and popular consumer products |journal=Scientific Reports |author=Jikomes, N.; Zoorob, M. |volume=8 |pages=4519 |year=2018 |doi=10.1038/s41598-018-22755-2}} | ||
| Line 6: | Line 6: | ||
|Permission=[https://creativecommons.org/licenses/by/4.0/ Creative Commons Attribution 4.0 International] | |Permission=[https://creativecommons.org/licenses/by/4.0/ Creative Commons Attribution 4.0 International] | ||
}} | }} | ||
== Licensing == | == Licensing == | ||
{{cc-by-4.0}} | {{cc-by-4.0}} | ||
Revision as of 21:35, 5 April 2019
Summary
| Description |
Figure 8. Popular Strain Names as Signal for THC and CBD Content. (a) Proportion of variation in log10 THC:CBD ratio explained by popular strain names (Intraclass Correlation Coefficient). 99% CIs are shown, by lab, before (black circles) and after (gray squares) filtering test results by the modal chemotype of each strain name. The ICC is shown both for dropping values for which 0% CBD or 0% THC is reported (left) and coercing cannabinoid ratios for these tests (see Methods). (b) Mean THC level of popular chemotype I strains. 99% CIs are shown after filtering by modal chemotype, for the lab reporting the lowest THC levels. (c) Mean CBD levels for popular chemotype II (above dotted line) and chemotype III (below dotted line) strain names. Results shown for the lab reporting the lowest mean THC levels. |
|---|---|
| Source |
Jikomes, N.; Zoorob, M. (2018). "The cannabinoid content of legal cannabis in Washington State varies systematically across testing facilities and popular consumer products". Scientific Reports 8: 4519. doi:10.1038/s41598-018-22755-2. |
| Date |
2018 |
| Author |
Jikomes, N.; Zoorob, M. |
| Permission (Reusing this file) |
|
| Other versions |
Licensing
|
|
This work is licensed under the Creative Commons Attribution 4.0 License. |
File history
Click on a date/time to view the file as it appeared at that time.
| Date/Time | Thumbnail | Dimensions | User | Comment | |
|---|---|---|---|---|---|
| current | 21:35, 5 April 2019 | 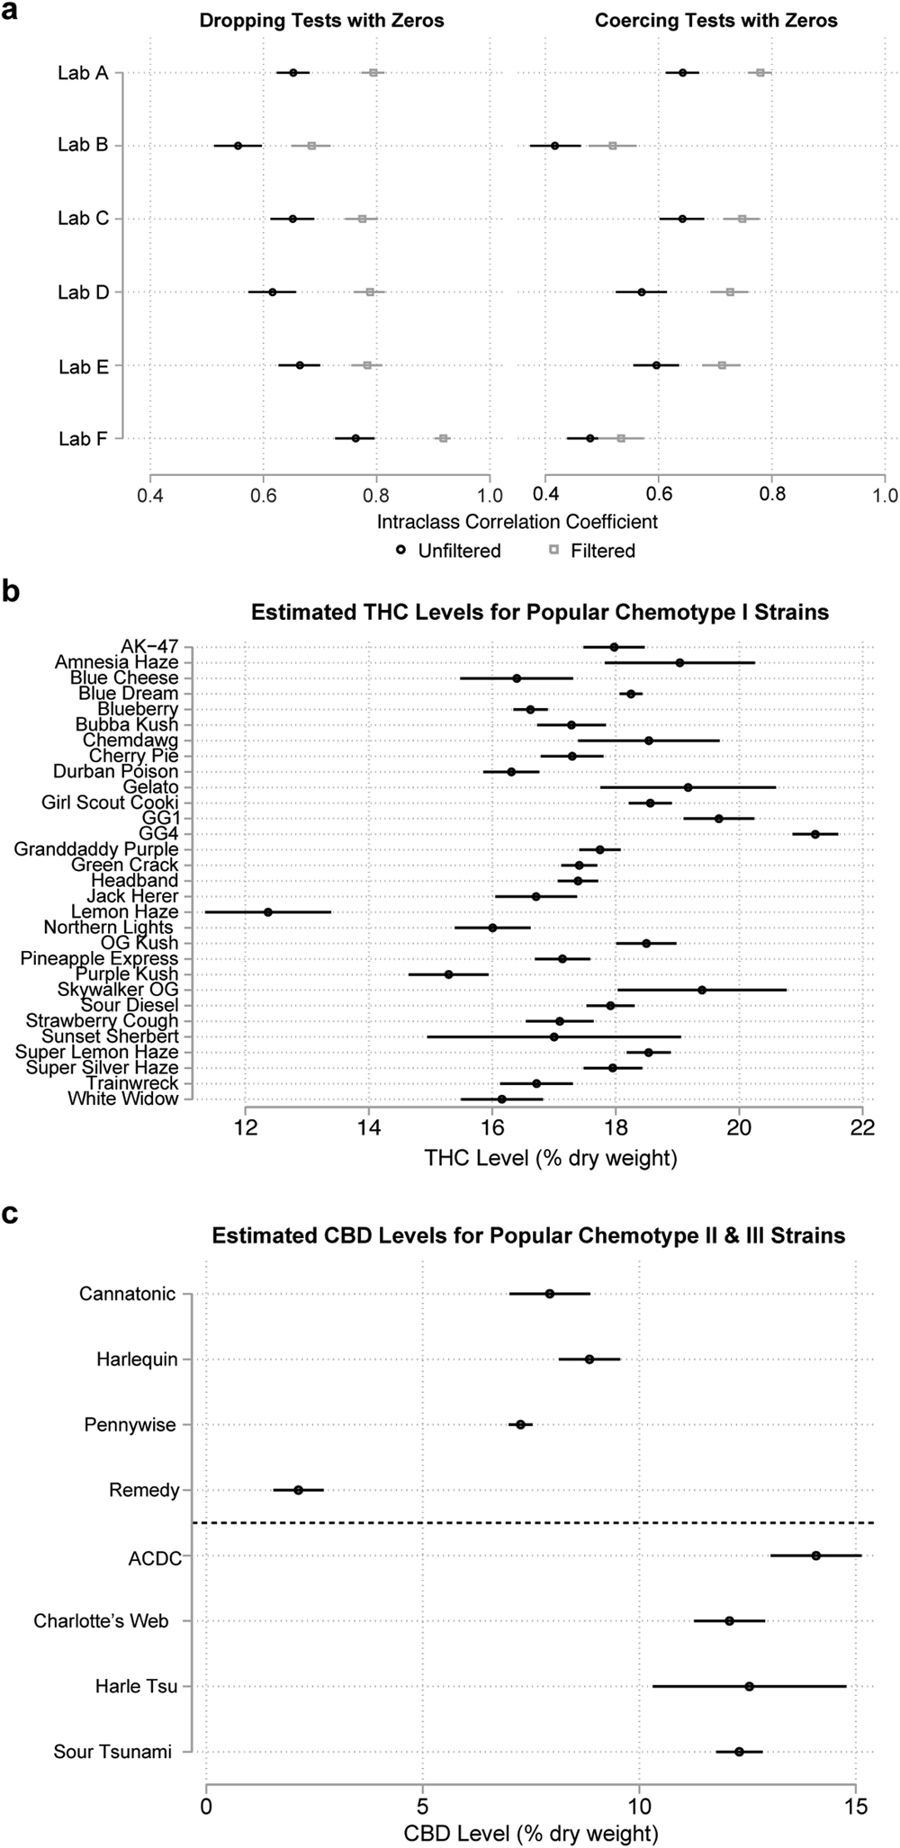 | 900 × 1,848 (160 KB) | Shawndouglas (talk | contribs) | {{Information |Description='''Figure 8.''' Popular Strain Names as Signal for THC and CBD Content. '''(a)''' Proportion of variation in log10 THC:CBD ratio explained by popular strain names (Intraclass Correlation Coefficient). 99% CIs are shown, by la... |
You cannot overwrite this file.


