Difference between revisions of "File:Fig2 Beaulieu-JonesJMIRMedInfo2018 6-1.png"
Shawndouglas (talk | contribs) |
Shawndouglas (talk | contribs) (Added summary.) |
||
| Line 1: | Line 1: | ||
==Summary== | |||
{{Information | |||
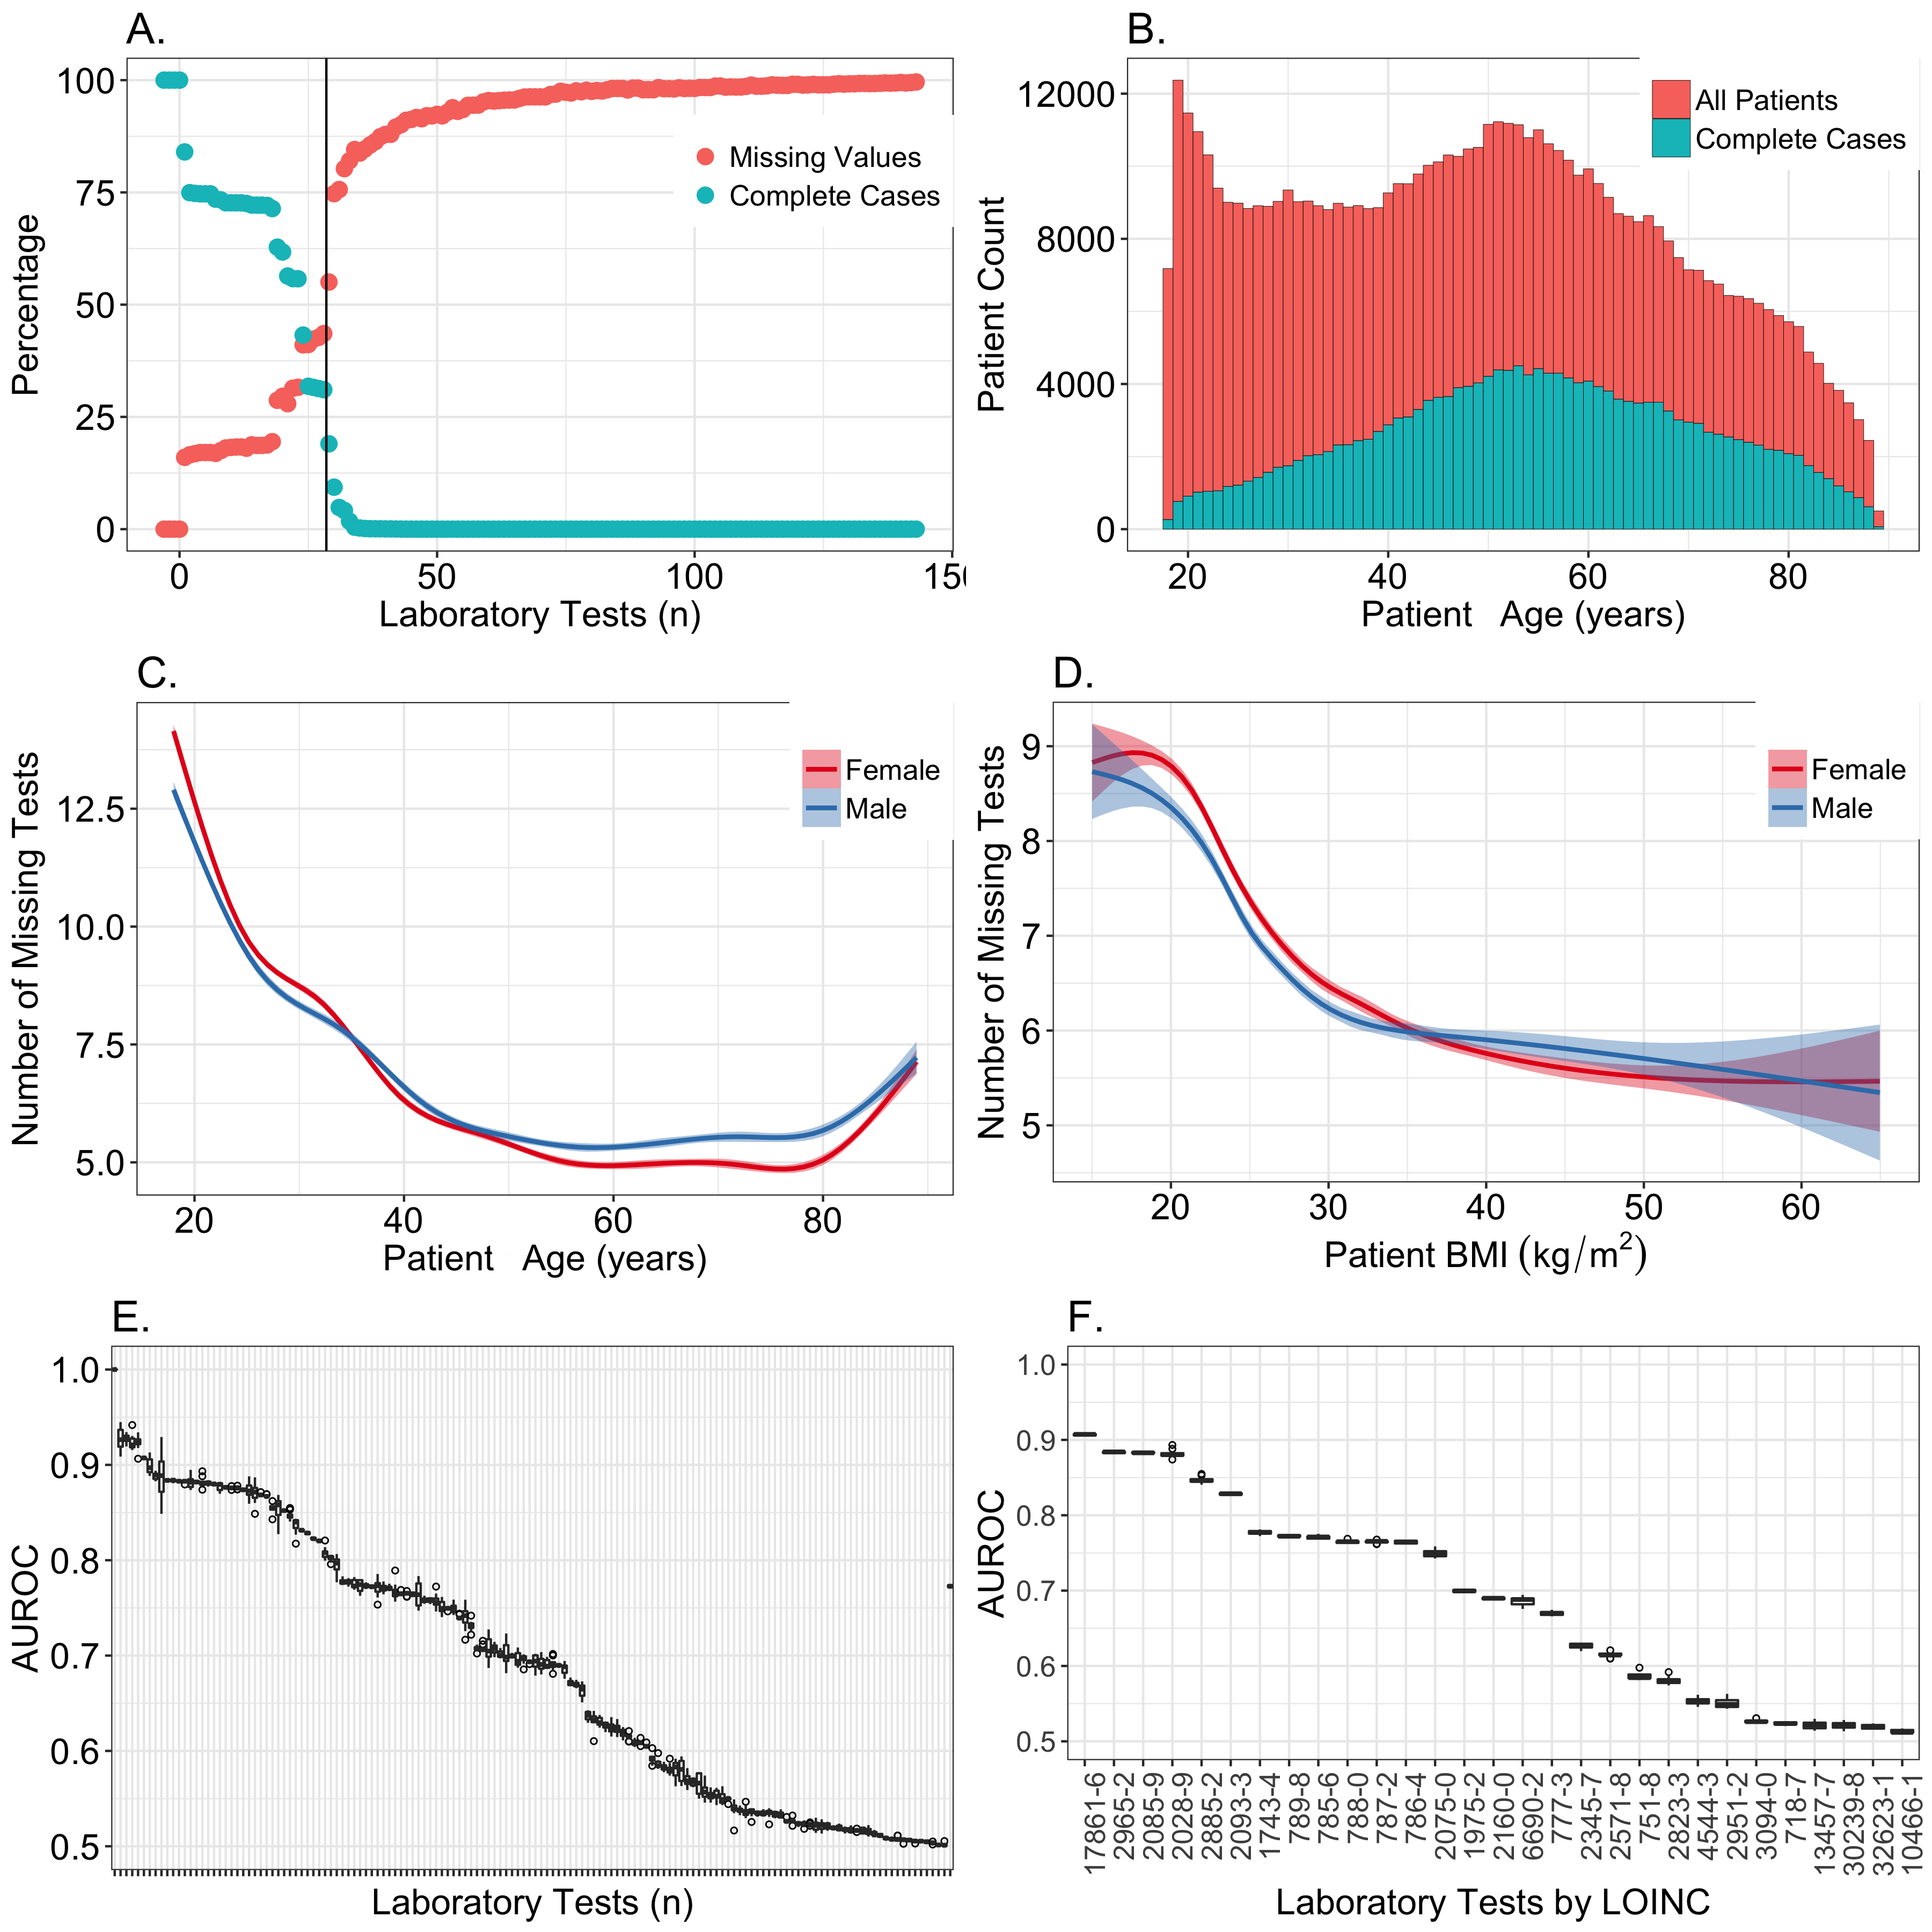
|Description='''Figure 2.''' Summary of missing data across 143 clinical laboratory measures. '''(A)''' After ranking the clinical laboratory measures by the number of total results, the percentage of patients missing a result for each test was plotted (red points). At each rank, the percentage of complete cases for all tests of equal or lower rank were also plotted (blue points). Only variables with a rank ≤75 are shown. The vertical bar indicates the 28 tests that were selected for further analysis. '''(B)''' The full distribution of patient median ages is shown in blue, and the fraction of individuals in each age group that had a complete set of observations for tests 1-28 are shown in red. '''(C)''' Within the 28 laboratory tests that were selected for imputation analyses, the mean number of missing tests is depicted as a function of age. '''(D)''' Within the 28 laboratory tests that were selected for imputation, the mean number of missing tests is depicted as a function of body mass index (BMI). '''(E)''' Accuracy of a random forest predicting the presence or absence of all 143 laboratory tests. AUROC: area under the receiver operating characteristic curve. '''(F)''' Accuracy of a random forest predicting the presence or absence of the top 28 laboratory tests, by Logical Observation Identifiers Names and Codes (LOINC). | |||
|Source={{cite journal |title=Characterizing and managing missing structured data in electronic health records: Data analysis |journal=JMIR Medical Informatics |author=Beaulieu-Jones, B.K.; Lavage, D.R.; Snyder, J.W.; Moore, J.H.; Pendergrass, S.A.; Bauer, C.R. |volume=6 |issue=1 |pages=e11 |year=2018 |doi=10.2196/medinform.8960}} | |||
|Author=Beaulieu-Jones, B.K.; Lavage, D.R.; Snyder, J.W.; Moore, J.H.; Pendergrass, S.A.; Bauer, C.R. | |||
|Date=2018 | |||
|Permission=[http://creativecommons.org/licenses/by/4.0/ Creative Commons Attribution 4.0 International] | |||
}} | |||
== Licensing == | == Licensing == | ||
{{cc-by-4.0}} | {{cc-by-4.0}} | ||
Latest revision as of 19:52, 6 March 2018
Summary
| Description |
Figure 2. Summary of missing data across 143 clinical laboratory measures. (A) After ranking the clinical laboratory measures by the number of total results, the percentage of patients missing a result for each test was plotted (red points). At each rank, the percentage of complete cases for all tests of equal or lower rank were also plotted (blue points). Only variables with a rank ≤75 are shown. The vertical bar indicates the 28 tests that were selected for further analysis. (B) The full distribution of patient median ages is shown in blue, and the fraction of individuals in each age group that had a complete set of observations for tests 1-28 are shown in red. (C) Within the 28 laboratory tests that were selected for imputation analyses, the mean number of missing tests is depicted as a function of age. (D) Within the 28 laboratory tests that were selected for imputation, the mean number of missing tests is depicted as a function of body mass index (BMI). (E) Accuracy of a random forest predicting the presence or absence of all 143 laboratory tests. AUROC: area under the receiver operating characteristic curve. (F) Accuracy of a random forest predicting the presence or absence of the top 28 laboratory tests, by Logical Observation Identifiers Names and Codes (LOINC). |
|---|---|
| Source |
Beaulieu-Jones, B.K.; Lavage, D.R.; Snyder, J.W.; Moore, J.H.; Pendergrass, S.A.; Bauer, C.R. (2018). "Characterizing and managing missing structured data in electronic health records: Data analysis". JMIR Medical Informatics 6 (1): e11. doi:10.2196/medinform.8960. |
| Date |
2018 |
| Author |
Beaulieu-Jones, B.K.; Lavage, D.R.; Snyder, J.W.; Moore, J.H.; Pendergrass, S.A.; Bauer, C.R. |
| Permission (Reusing this file) |
|
| Other versions |
Licensing
|
|
This work is licensed under the Creative Commons Attribution 4.0 License. |
File history
Click on a date/time to view the file as it appeared at that time.
| Date/Time | Thumbnail | Dimensions | User | Comment | |
|---|---|---|---|---|---|
| current | 19:47, 6 March 2018 |  | 3,600 × 3,600 (694 KB) | Shawndouglas (talk | contribs) |
You cannot overwrite this file.
File usage
The following page uses this file:


