Difference between revisions of "LII:Notes on Instrument Data Systems"
Shawndouglas (talk | contribs) (Saving and adding more.) |
Shawndouglas (talk | contribs) (Saving and adding more.) |
||
| Line 119: | Line 119: | ||
|} | |} | ||
|} | |} | ||
The output of the instrument is a voltage (the “Analog Output” element in the model) that is connected to the recorder. The “Data Acquisition & Processing” and “Control Systems & Communication” elements are, to put it simply, you and your calculator. | |||
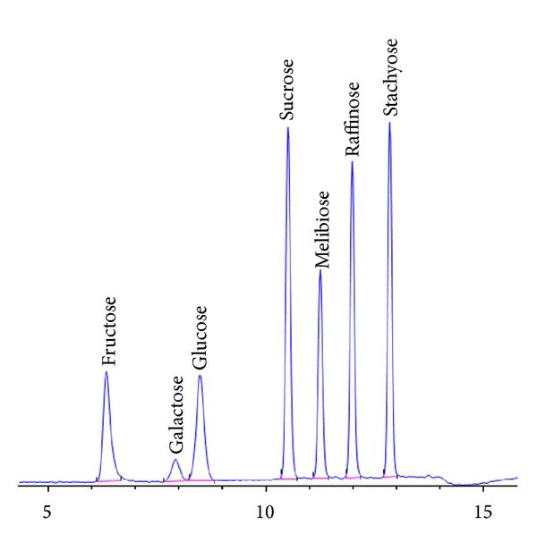
Now let's look at a typical chromatogram from a modern instrument (Figure 6). | |||
[[File:Fig6 Liscouski NotesOnInstDataSys20.png|500px]] | |||
{{clear}} | |||
{| | |||
| STYLE="vertical-align:top;"| | |||
{| border="0" cellpadding="5" cellspacing="0" width="500px" | |||
|- | |||
| style="background-color:white; padding-left:10px; padding-right:10px;"| <blockquote>'''Figure 6.''' This chromatogram shows the separation of sugars in a mixture.<ref name="ValliyodanASimp15">{{cite journal |title=A Simple Analytical Method for High-Throughput Screening of Major Sugars from Soybean by Normal-Phase HPLC with Evaporative Light Scattering Detection |journal=Chromatography Research International |author=Valliyodan, B.; Shi, H.; Nguyen, H.T. |volume=2015 |at=757649 |year=2015 |doi=10.1155/2015/757649}}</ref> In an analog chromatogram, the line would be smooth since it would come from a continuous signal that was being recorded in real-time. Images like this will often show stair-stepping on the peaks, a result of a computer sampling the signal periodically (possibly 20 to 50 times/sec depending on settings), and the resulting image is a connect-the-dots display of the sampled readings. This is a characteristic difference between real-time strip-chart analog recording and digital systems (though not a criticism of this particular chromatogram).</blockquote> | |||
|- | |||
|} | |||
|} | |||
As Figure 6 demonstrates, chromatograms are a series of peaks. Those peaks represent the retention time (how long it takes a molecule to elute after injection) and can be used to help determine a molecule's identity (other techniques such as MS may be used to confirm it). The size of the peak is used in quantitative analysis. | |||
==Footnotes== | ==Footnotes== | ||
Revision as of 20:35, 13 February 2021
Title: Notes on Instrument Data Systems
Author for citation: Joe Liscouski, with editorial modifications by Shawn Douglas
License for content: Creative Commons Attribution 4.0 International
Publication date: May 27, 2020
Introduction
The goal of this brief paper is to examine what it will take to advance laboratory operations in terms of technical content, data quality, and productivity. Advancements in the past have been incremental, and isolated, the result of an individual's or group's work and not part of a broad industry plan. Disjointed, uncoordinated, incremental improvements have to give way to planned, directed methods, such that appropriate standards and products can be developed and mutually beneficial R&D programs instituted. We’ve long since entered a phase where the cost of technology development and implementation is too high to rely on a “let’s try this” approach as the dominant methodology. Making progress in lab technologies is too important to be done without some direction (i.e., deliberate planning). Individual insights, inspiration, and “out of the box” thinking is always valuable; it can inspire a change in direction. But building to a purpose is equally important. This paper revisits past developments in instrument data systems (IDS), looks at issues that need attention as we further venture into the use of integrated informatics systems, and suggests some directions further development can take.
There is a second aspect beyond planning that also deserves attention: education. Yes, there are people who really know what they are doing with instrumental systems and data handling. However, that knowledge base isn’t universal across labs. Many industrial labs and schools have people using instrument data systems with no understanding of what is happening to their data. Others such as Hinshaw and Stevenson et al. have commented on this phenomena in the past:
Chromatographers go to great lengths to prepare, inject, and separate their samples, but they sometimes do not pay as much attention to the next step: peak detection and measurement ... Despite a lot of exposure to computerized data handling, however, many practicing chromatographers do not have a good idea of how a stored chromatogram file—a set of data points arrayed in time—gets translated into a set of peaks with quantitative attributes such as area, height, and amount.[1]
At this point, I noticed that the discussion tipped from an academic recitation of technical needs and possible solutions to a session driven primarily by frustrations. Even today, the instruments are often more sophisticated than the average user, whether he/she is a technician, graduate student, scientist, or principal investigator using chromatography as part of the project. Who is responsible for generating good data? Can the designs be improved to increase data integrity?[2]
We can expect that the same issue holds true for even more demanding individual or combined techniques. Unless lab personnel are well-educated in both the theory and practice of their work, no amount of automation—including any IDS components—is going to matter in the development of usable data and information.
The IDS entered the laboratory initially as an aid to analysts doing their work. Its primary role was to off-load tedious measurements and calculations, giving analysts more time to inspect and evaluate lab results. The IDS has since morphed from a convenience to a necessity, and then to being a presumed part of an instrument system. That raises two sets of issues that we’ll address here regarding people, technologies, and their intesections:
1. People: Do the users of an IDS understand what is happening to their data once it leaves the instrument and enters the computer? Do they understand the settings that are available and the effect they have on data processing, as well as the potential for compromising the results of the analytical bench work? Are lab personnel educated so that they are effective and competent users of all the technologies used in the course of their work?
2. Technologies: Are the systems we are using up to the task that has been assigned to them as we automate laboratory functions?
We’ll begin with some basic material and then develop the argument from there.
An overall model for laboratory processes and instrumentation
Laboratory work is dependent upon instruments, and the push for higher productivity is driving us toward automation. What may be lost in all this, particularly to those new to lab procedures, is an understanding of how things work, and how computer systems control the final steps in a process. Without that understanding, good bench work can be reduced to bad and misleading results. If you want to guard against that prospect, you have to understand how instrument data systems work, as well as your role in ensuring accurate results.
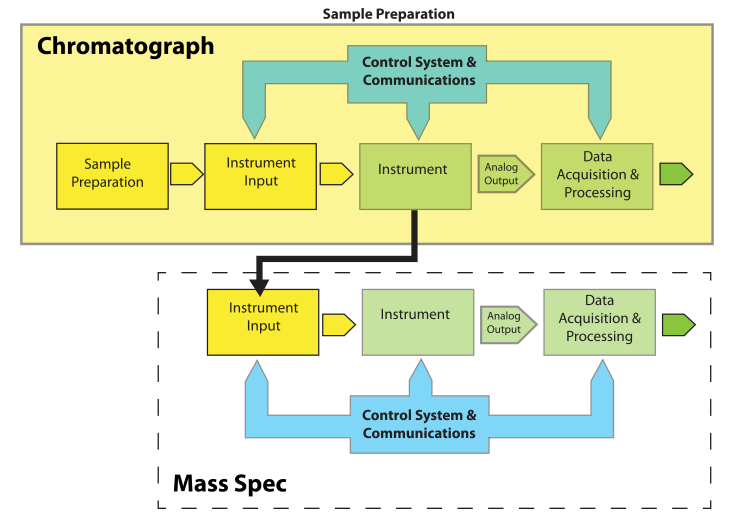
Let's begin by looking at a model for lab processes (Figure 1) and define the important elements.
|
Most of the elements of Figure 1 are easy to understand. "Instrument Input" could be an injection port, an autosampler, or the pan on a balance. “Control Systems & Communications,” normally part of the same electronics package as “Data Acquisition & Processing,” is separated out to provide for hierarchical control configurations that might be found in, e.g., robotics systems. The model is easily expanded to describe hyphenated systems such as gas chromatography–mass spectrometry (GC-MS) applications, as shown in Figure 2. Mass spectrometers are best used when you have a clean sample (no contaminants), while chromatographs are great at separating mixtures and isolating components in the effluent. The combination of instruments makes an effective tool for separating and identifying the components in mixtures.
|
Note that the chromatographic system and its associated components become the "Sample Preparation" element from Figure 1 when viewed from the perspective of the mass spectrometer (MS). The flow out of the chromatographic column is split (if needed, depending on the detector used, while controlling the input to the MS) so that the eluted material is directed to the input of the MS. Each eluted component from the chromatograph becomes a sample to the MS.
Instruments vs. instrument packages
One important feature of the model shown in Figure 1 is that arrow labeled “Analog Output”; this emphasizes that the standard output of instruments is an analog "response" or voltage. The response can take the form of a needle movement across a scale, a deflection, or some other indication (e.g., a level in a mercury or alcohol thermometer). Voltage output can be read with a meter or strip chart recorder. There are no instruments with digital outputs; they are all analog output devices.
On the other hand, instruments that appear to be digital devices are the result of packaging by the manufacturer. That packaging contains the analog signal-generating instrument, with a voltage output that is connected to an analog-to-digital converter.
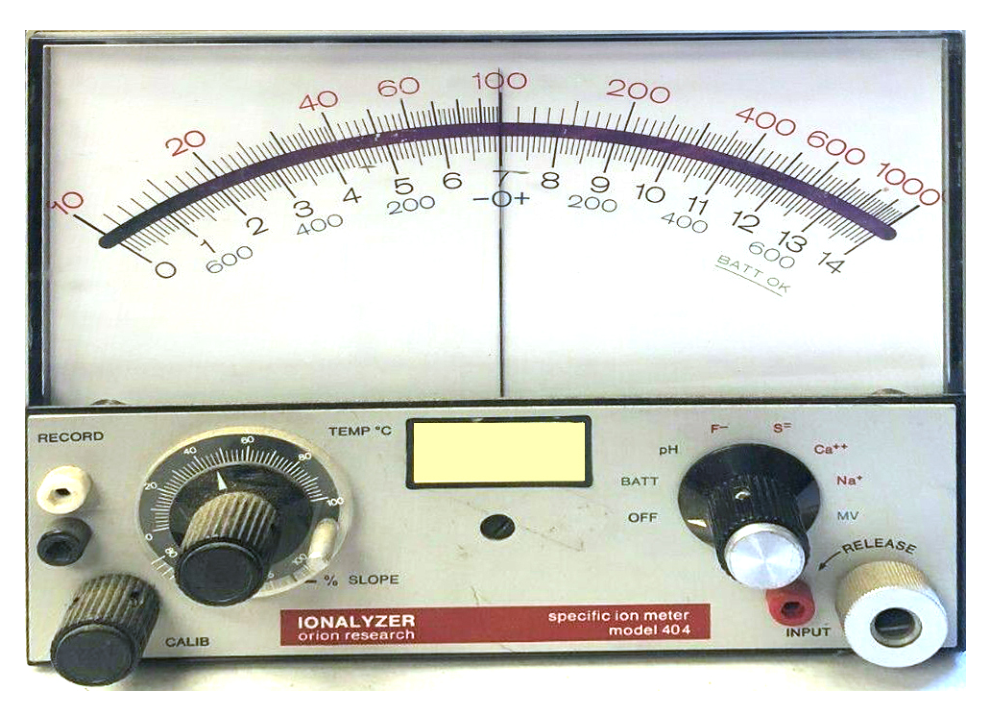
Take for example analog pH meters, which are in reality millivolt meters with a pH scale added to the meter face. If you look at Figure 3, the lower switch position has a setting for both MV (millivolt) and pH. When you read the pH on the meter, you are doing an analog-to-digital conversion; the needle's movement is the result of the incoming voltage from the pH electrode. The “pH reading” is performed by you as you project the needle's position onto the scale and note the corresponding numeric value.
|
A digital pH meter has the following components from our model (Figure 1) incorporated into the instrument package (the light green elements in the model):
- The instrument - One or more electrodes provide the analog signal, which depends on the pH of the solution.
- Data acquisition and processing – An external connection connects the electrodes to an analog-to-digital converter that converts the incoming voltage to a digital value that is in turn used to calculate the pH.
- Control systems and communication – This manages the digital display, front panel control functions, and, if present, the RS-232/422/485 or network communications. If the communications feature is there, this module also interprets and responds to commands from an external computer.
Working with more sophisticated instruments
Prior to the introduction of computers to instruments, the common method of viewing the instruments output was through meters and strip-chart recorders. That meant two things: all the measurements and calculations were done by hand, and you were intimately familiar with your data. Both those points are significant and have ramifications that warrant serious consideration in today’s labs.
In order to keep things simple, let's focus on chromatography, although the points raised will have application to spectroscopy, thermal analysis, and other instrumental techniques in chemistry; material science; physics; and other domains. Chromatography has the richest history of automation in laboratory work, it is widely used, and gives us a model for thinking about other techniques. You will not have to be an expert in chromatography to understand what follows.[a] To put it simply, chromatography is a technique for taking complex mixtures and allowing the analyst (with a bit of work) to separate the components of the mixture and determine what those components might be and quantify them.
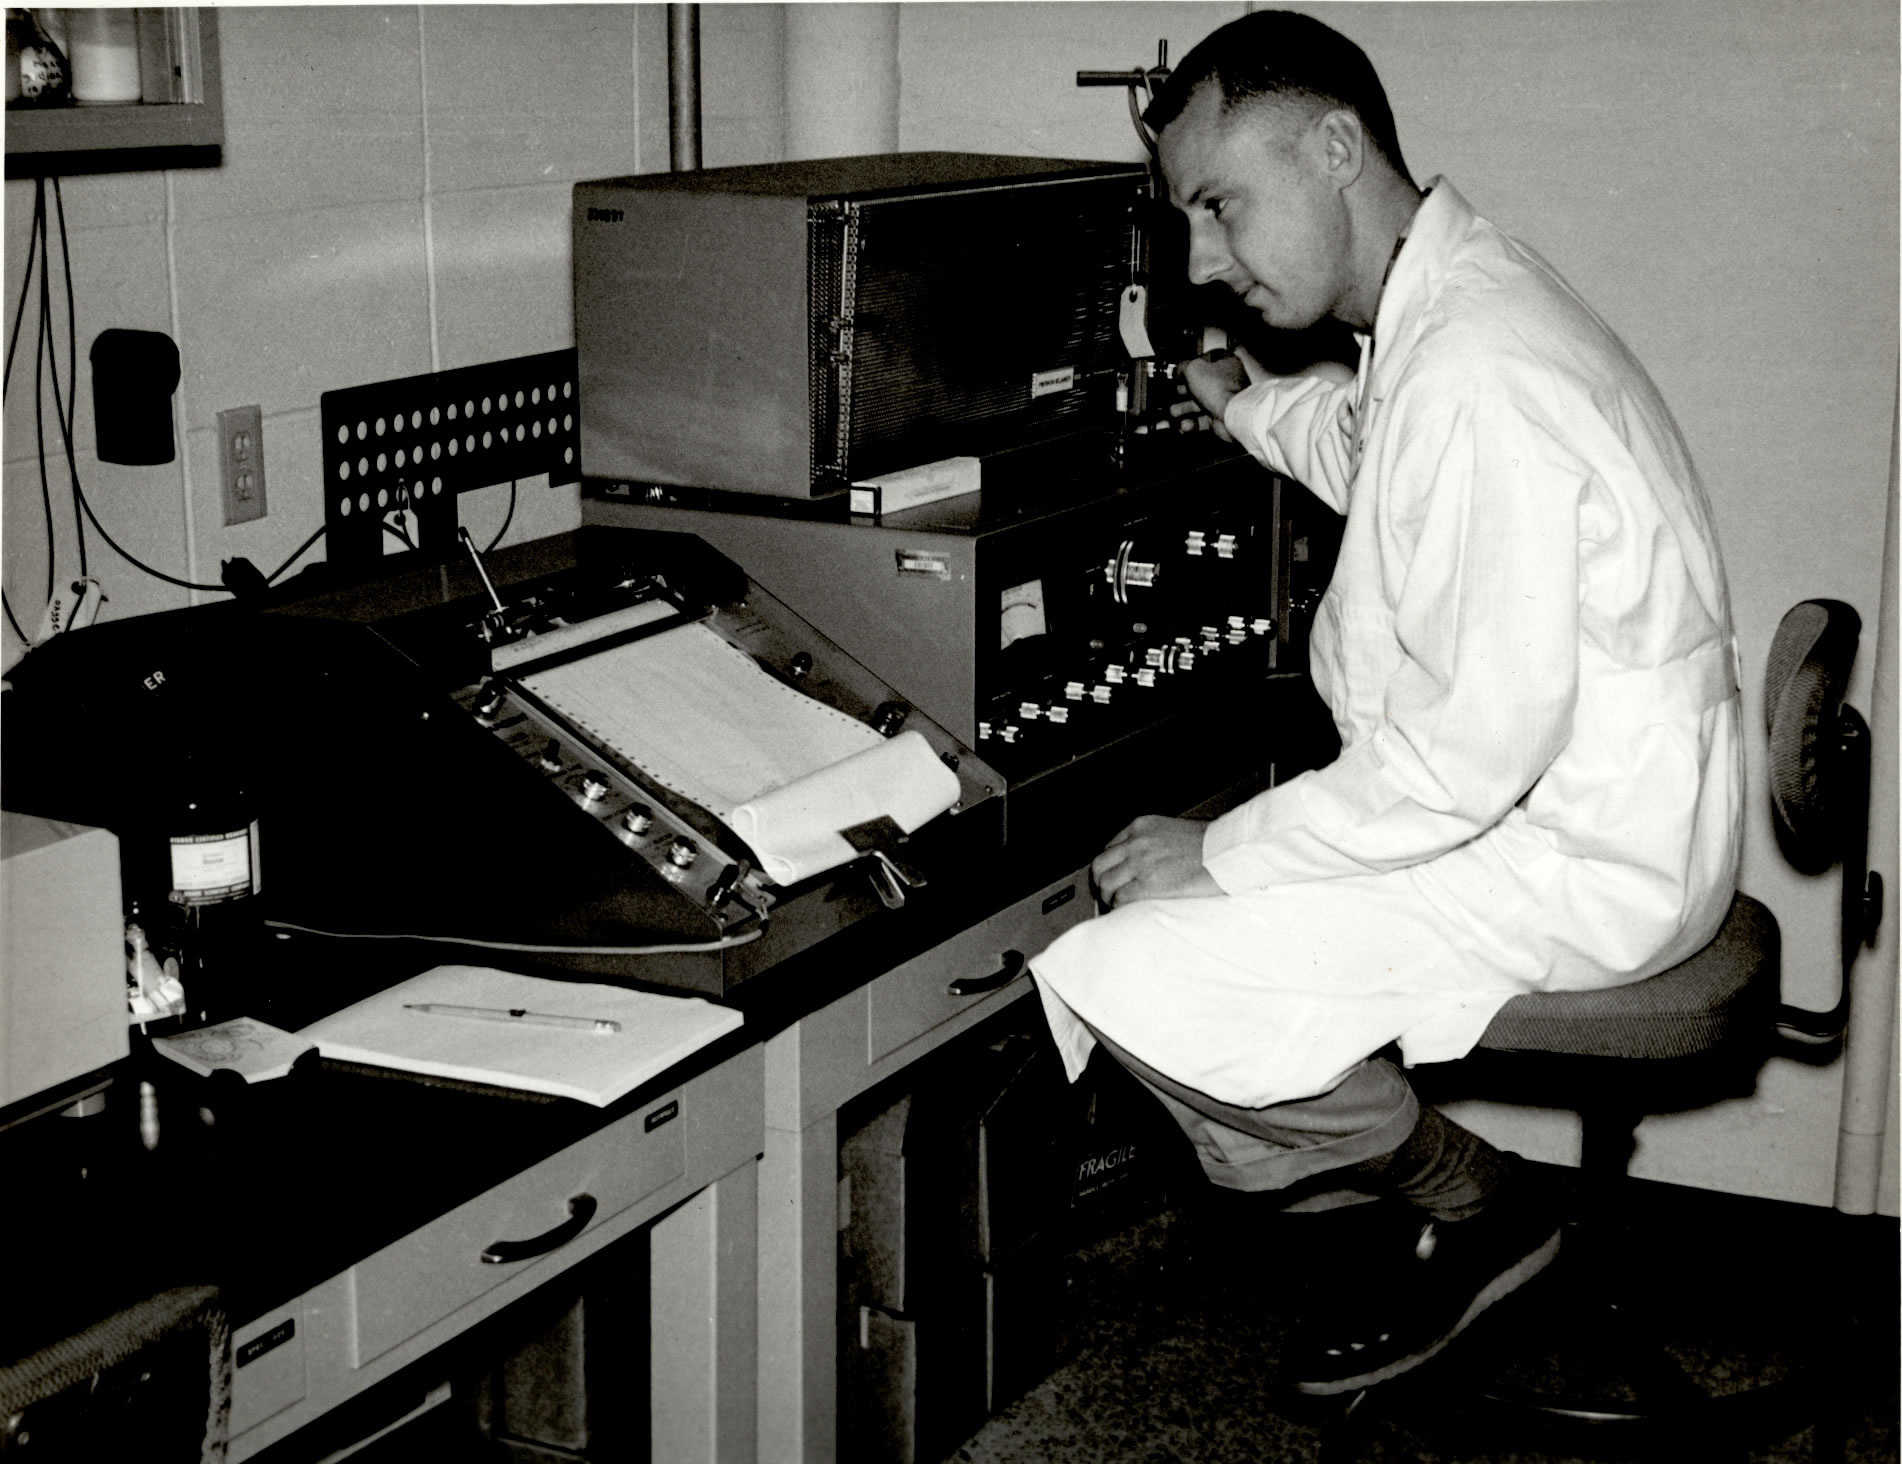
Older chromatographs looked like the instrument in front of the technician in Figure 4:
|
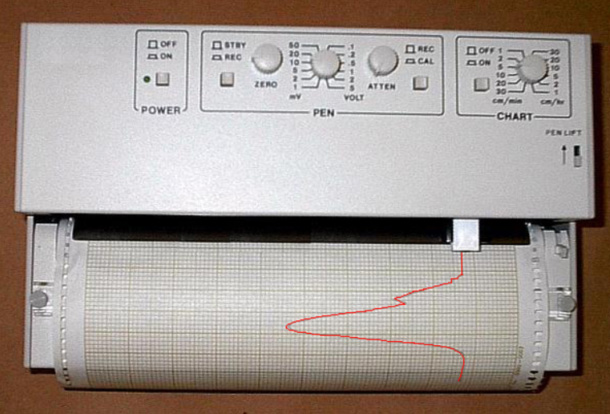
The instruments output was an analog signal, a voltage, that was recorded on a strip-chart recorder using a pen trace on moving chart paper, as shown in Figure 5 (the red line is the recorded signal; the baseline would be on the right).
|
The output of the instrument is a voltage (the “Analog Output” element in the model) that is connected to the recorder. The “Data Acquisition & Processing” and “Control Systems & Communication” elements are, to put it simply, you and your calculator.
Now let's look at a typical chromatogram from a modern instrument (Figure 6).
|
As Figure 6 demonstrates, chromatograms are a series of peaks. Those peaks represent the retention time (how long it takes a molecule to elute after injection) and can be used to help determine a molecule's identity (other techniques such as MS may be used to confirm it). The size of the peak is used in quantitative analysis.
Footnotes
- ↑ If you’d like to familiarize yourself with the technique, however, there are a many sources online, e.g., Khan Academy.
About the author
Initially educated as a chemist, author Joe Liscouski (joe dot liscouski at gmail dot com) is an experienced laboratory automation/computing professional with over forty years of experience in the field, including the design and development of automation systems (both custom and commercial systems), LIMS, robotics and data interchange standards. He also consults on the use of computing in laboratory work. He has held symposia on validation and presented technical material and short courses on laboratory automation and computing in the U.S., Europe, and Japan. He has worked/consulted in pharmaceutical, biotech, polymer, medical, and government laboratories. His current work centers on working with companies to establish planning programs for lab systems, developing effective support groups, and helping people with the application of automation and information technologies in research and quality control environments.
References
- ↑ Hinshaw, J.V. (2014). "Finding a Needle in a Haystack". LCGC Europe 27 (11): 584–89. https://www.chromatographyonline.com/view/finding-needle-haystack-0.
- ↑ Stevenson, R.L.; Lee, M.; Gras, R. (1 September 2011). "The Future of GC Instrumentation From the 35th International Symposium on Capillary Chromatography (ISCC)". American Laboratory. https://americanlaboratory.com/913-Technical-Articles/34439-The-Future-of-GC-Instrumentation-From-the-35th-International-Symposium-on-Capillary-Chromatography-ISCC/.
- ↑ Valliyodan, B.; Shi, H.; Nguyen, H.T. (2015). "A Simple Analytical Method for High-Throughput Screening of Major Sugars from Soybean by Normal-Phase HPLC with Evaporative Light Scattering Detection". Chromatography Research International 2015: 757649. doi:10.1155/2015/757649.

