Difference between revisions of "File:Fig1 Jikomes SciReports2018 8.jpg"
Shawndouglas (talk | contribs) (Added summary) |
Shawndouglas (talk | contribs) m (2 revisions imported) |
||
| (One intermediate revision by the same user not shown) | |||
| Line 1: | Line 1: | ||
==Summary== | == Summary == | ||
{{Information | {{Information | ||
|Description='''Figure 1.''' The THC:CBD ratio defines three broad chemotypes of commercial cannabis flower measured by testing labs in Washington. Left column: Scatterplots of total THC vs. total CBD levels for cannabis flower. Right column: Histograms showing the THC:CBD ratio on a log scale and indicating the proportion of flower samples for each chemotype. Data are displayed for measurements batched across all Labs A-F (panels a-b; n = 175,136), for the lab reporting the lowest mean total THC levels (Lab A; panels c-d; n = 62,719), and the lab reporting the highest mean total THC levels (Lab F; panels e-f; n=26,664). Histograms for each of the six labs contributing to batched data in panels a-b are shown in Figure S1. Panels a and c were subsampled to n=50,000 for visualization purposes. |Source={{cite journal |title= The cannabinoid content of legal cannabis in Washington State varies systematically across testing facilities and popular consumer products |journal=Scientific Reports |author=Jikomes, N.; Zoorob, M. |volume=8 |pages=4519 |year=2018 |doi=10.1038/s41598-018-22755-2}} | |Description='''Figure 1.''' The THC:CBD ratio defines three broad chemotypes of commercial cannabis flower measured by testing labs in Washington. Left column: Scatterplots of total THC vs. total CBD levels for cannabis flower. Right column: Histograms showing the THC:CBD ratio on a log scale and indicating the proportion of flower samples for each chemotype. Data are displayed for measurements batched across all Labs A-F (panels a-b; n = 175,136), for the lab reporting the lowest mean total THC levels (Lab A; panels c-d; n = 62,719), and the lab reporting the highest mean total THC levels (Lab F; panels e-f; n=26,664). Histograms for each of the six labs contributing to batched data in panels a-b are shown in Figure S1. Panels a and c were subsampled to n=50,000 for visualization purposes. |Source={{cite journal |title= The cannabinoid content of legal cannabis in Washington State varies systematically across testing facilities and popular consumer products |journal=Scientific Reports |author=Jikomes, N.; Zoorob, M. |volume=8 |pages=4519 |year=2018 |doi=10.1038/s41598-018-22755-2}} | ||
Latest revision as of 22:46, 20 December 2023
Summary
| Description |
Figure 1. The THC:CBD ratio defines three broad chemotypes of commercial cannabis flower measured by testing labs in Washington. Left column: Scatterplots of total THC vs. total CBD levels for cannabis flower. Right column: Histograms showing the THC:CBD ratio on a log scale and indicating the proportion of flower samples for each chemotype. Data are displayed for measurements batched across all Labs A-F (panels a-b; n = 175,136), for the lab reporting the lowest mean total THC levels (Lab A; panels c-d; n = 62,719), and the lab reporting the highest mean total THC levels (Lab F; panels e-f; n=26,664). Histograms for each of the six labs contributing to batched data in panels a-b are shown in Figure S1. Panels a and c were subsampled to n=50,000 for visualization purposes. |
|---|---|
| Source |
Jikomes, N.; Zoorob, M. (2018). "The cannabinoid content of legal cannabis in Washington State varies systematically across testing facilities and popular consumer products". Scientific Reports 8: 4519. doi:10.1038/s41598-018-22755-2. |
| Date |
2018 |
| Author |
Jikomes, N.; Zoorob, M. |
| Permission (Reusing this file) |
|
| Other versions |
Licensing
|
|
This work is licensed under the Creative Commons Attribution 4.0 License. |
File history
Click on a date/time to view the file as it appeared at that time.
| Date/Time | Thumbnail | Dimensions | User | Comment | |
|---|---|---|---|---|---|
| current | 21:29, 5 April 2019 | 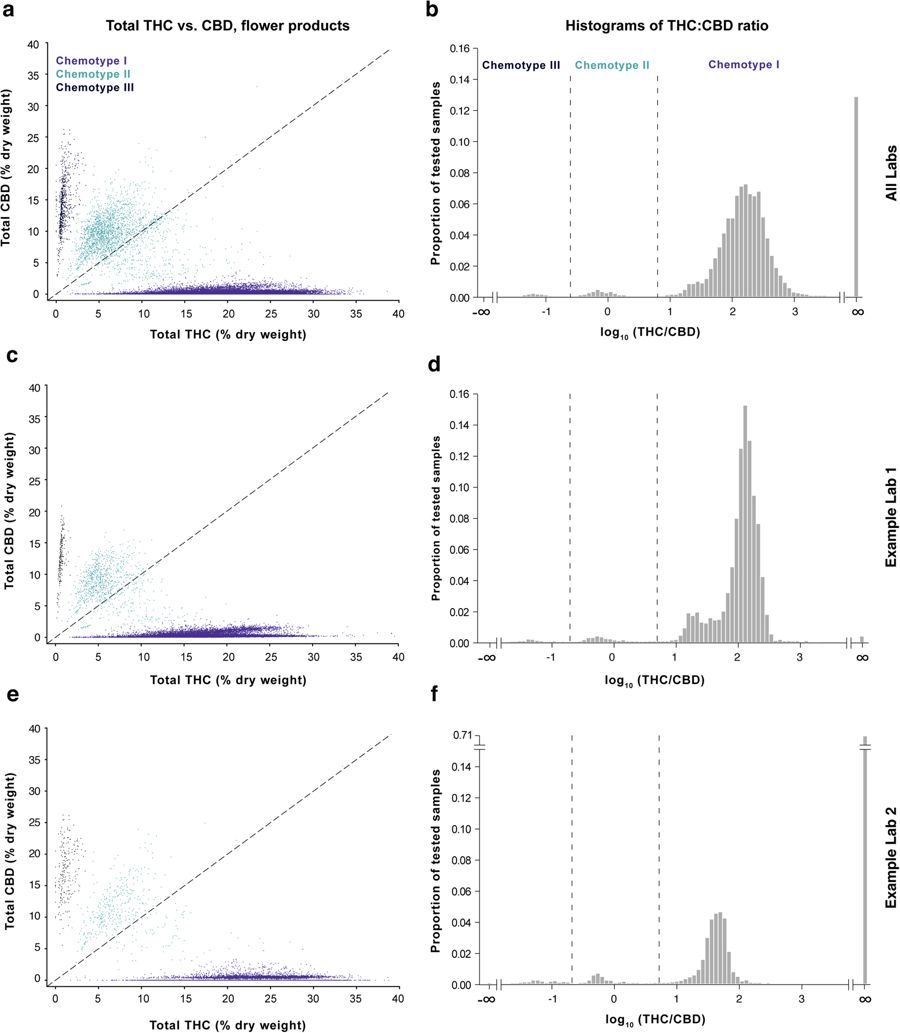 | 900 × 1,033 (80 KB) | Shawndouglas (talk | contribs) | {{Information |Description='''Figure 1.''' The THC:CBD ratio defines three broad chemotypes of commercial cannabis flower measured by testing labs in Washington. Left column: Scatterplots of total THC vs. total CBD levels for cannabis flower. Right col... |
You cannot overwrite this file.


