Difference between revisions of "File:Fig4 Stocker BMCBioinformatics2009 10.jpg"
Shawndouglas (talk | contribs) |
Shawndouglas (talk | contribs) (Added summary.) |
||
| Line 1: | Line 1: | ||
==Summary== | |||
{{Information | |||
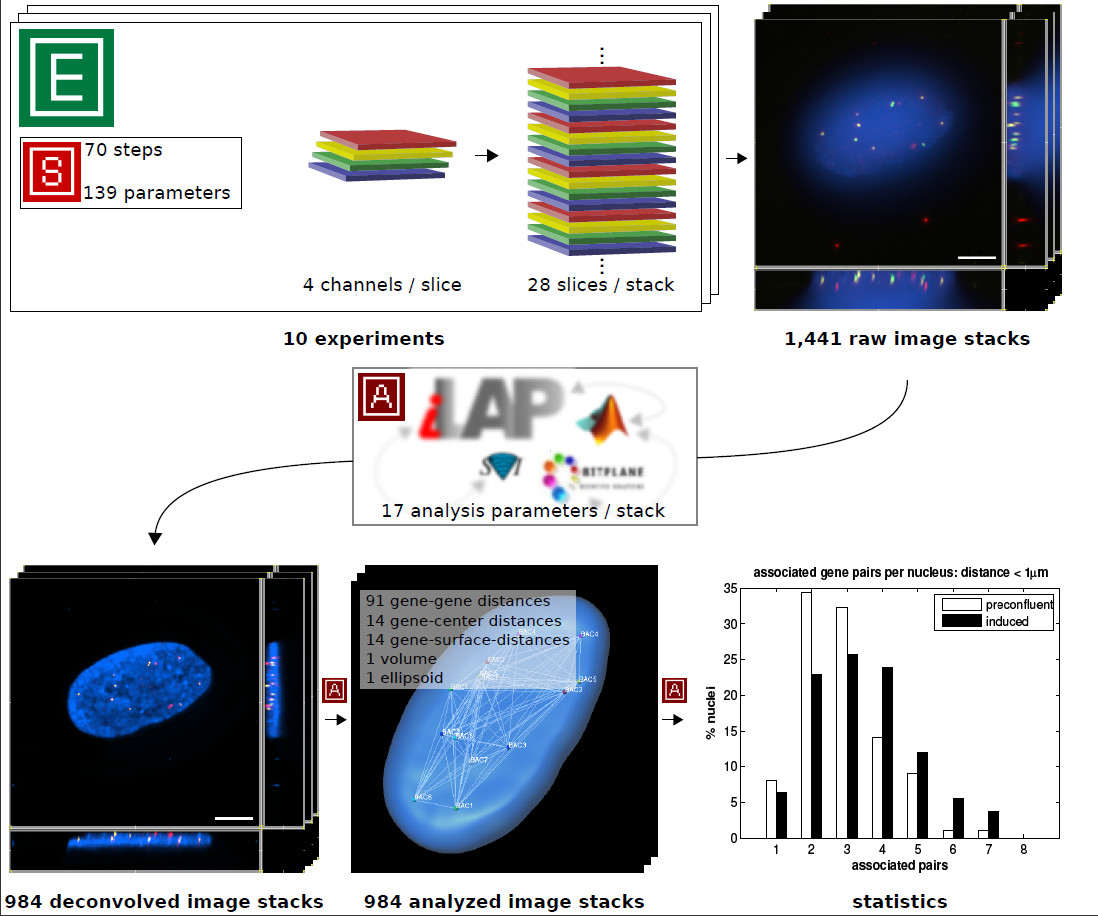
|Description=Figure 4: '''Case study summary.''' The functionality of iLAP was tested in a high-throughput microscopy study. The figure illustrates a summary of the data acquisition and data analysis performed. In 10 experiments a protocol consisting of 70 steps with 139 different parameters was used to generate three-dimensional multicolor image stacks. Each of the 1,441 raw image stacks consisted of 28 optical sections (slices) where each slice was recorded in 4 different channels. The raw image stacks were stored in the iLAP system and thereby connected with the corresponding experiments and protocols. By utilizing the integrated analysis functionality of iLAP the 984 raw images processed by the Huygens 3D-deconvolution package and analyzed by an external semiautomatic procedure implemented in Matlab and Imaris-XT. The analytical pipeline produced data for 121 different distance measurements of each single image. The resulting images and data were then stored in their experimental context within the iLAP system. | |||
|Source={{cite journal |url=http://www.biomedcentral.com/1471-2105/10/390 |title=iLAP: a workflow-driven software for experimental protocol development, data acquisition and analysis |journal=BMC Bioinformatics |author=Stocker, Gernot; Fischer, Maria; Rieder, Dietmar; Bindea, Gabriela; Kainz, Simon; Oberstolz, Michael; McNally, James G.; Trajanoski, Zlatko |volume=10 |pages=390 |year=2009 |doi= 10.1186/1471-2105-10-390 |issn=1471-2105}} | |||
|Author=Stocker, Gernot; Fischer, Maria; Rieder, Dietmar; Bindea, Gabriela; Kainz, Simon; Oberstolz, Michael; McNally, James G.; Trajanoski, Zlatko | |||
|Date=2009 | |||
|Permission=[https://creativecommons.org/licenses/by/2.0/ Creative Commons Attribution 2.0] | |||
}} | |||
== Licensing == | == Licensing == | ||
{{cc-by-2.0}} | {{cc-by-2.0}} | ||
Latest revision as of 18:18, 19 August 2015
Summary
| Description |
Figure 4: Case study summary. The functionality of iLAP was tested in a high-throughput microscopy study. The figure illustrates a summary of the data acquisition and data analysis performed. In 10 experiments a protocol consisting of 70 steps with 139 different parameters was used to generate three-dimensional multicolor image stacks. Each of the 1,441 raw image stacks consisted of 28 optical sections (slices) where each slice was recorded in 4 different channels. The raw image stacks were stored in the iLAP system and thereby connected with the corresponding experiments and protocols. By utilizing the integrated analysis functionality of iLAP the 984 raw images processed by the Huygens 3D-deconvolution package and analyzed by an external semiautomatic procedure implemented in Matlab and Imaris-XT. The analytical pipeline produced data for 121 different distance measurements of each single image. The resulting images and data were then stored in their experimental context within the iLAP system. |
|---|---|
| Source |
Stocker, Gernot; Fischer, Maria; Rieder, Dietmar; Bindea, Gabriela; Kainz, Simon; Oberstolz, Michael; McNally, James G.; Trajanoski, Zlatko (2009). "iLAP: a workflow-driven software for experimental protocol development, data acquisition and analysis". BMC Bioinformatics 10: 390. doi:10.1186/1471-2105-10-390. ISSN 1471-2105. http://www.biomedcentral.com/1471-2105/10/390. |
| Date |
2009 |
| Author |
Stocker, Gernot; Fischer, Maria; Rieder, Dietmar; Bindea, Gabriela; Kainz, Simon; Oberstolz, Michael; McNally, James G.; Trajanoski, Zlatko |
| Permission (Reusing this file) |
|
| Other versions |
Licensing
|
|
This work is licensed under the Creative Commons Attribution 2.0 License. |
File history
Click on a date/time to view the file as it appeared at that time.
| Date/Time | Thumbnail | Dimensions | User | Comment | |
|---|---|---|---|---|---|
| current | 18:17, 19 August 2015 |  | 1,098 × 916 (197 KB) | Shawndouglas (talk | contribs) |
You cannot overwrite this file.
File usage
The following page uses this file:


