Difference between revisions of "Template:Article of the week"
From LIMSWiki
Jump to navigationJump to searchShawndouglas (talk | contribs) (Updated article of the week text) |
Shawndouglas (talk | contribs) (Updated article of the week text) |
||
| (91 intermediate revisions by the same user not shown) | |||
| Line 1: | Line 1: | ||
<div style="float: left; margin: 0.5em 0.9em 0.4em 0em;">[[File: | <div style="float: left; margin: 0.5em 0.9em 0.4em 0em;">[[File:Fig1 Soto-Perdomo SoftwareX2023 24.jpg|240px]]</div> | ||
'''"[[ | '''"[[Journal:OptiGUI DataCollector: A graphical user interface for automating the data collecting process in optical and photonics labs|OptiGUI DataCollector: A graphical user interface for automating the data collecting process in optical and photonics labs]]"''' | ||
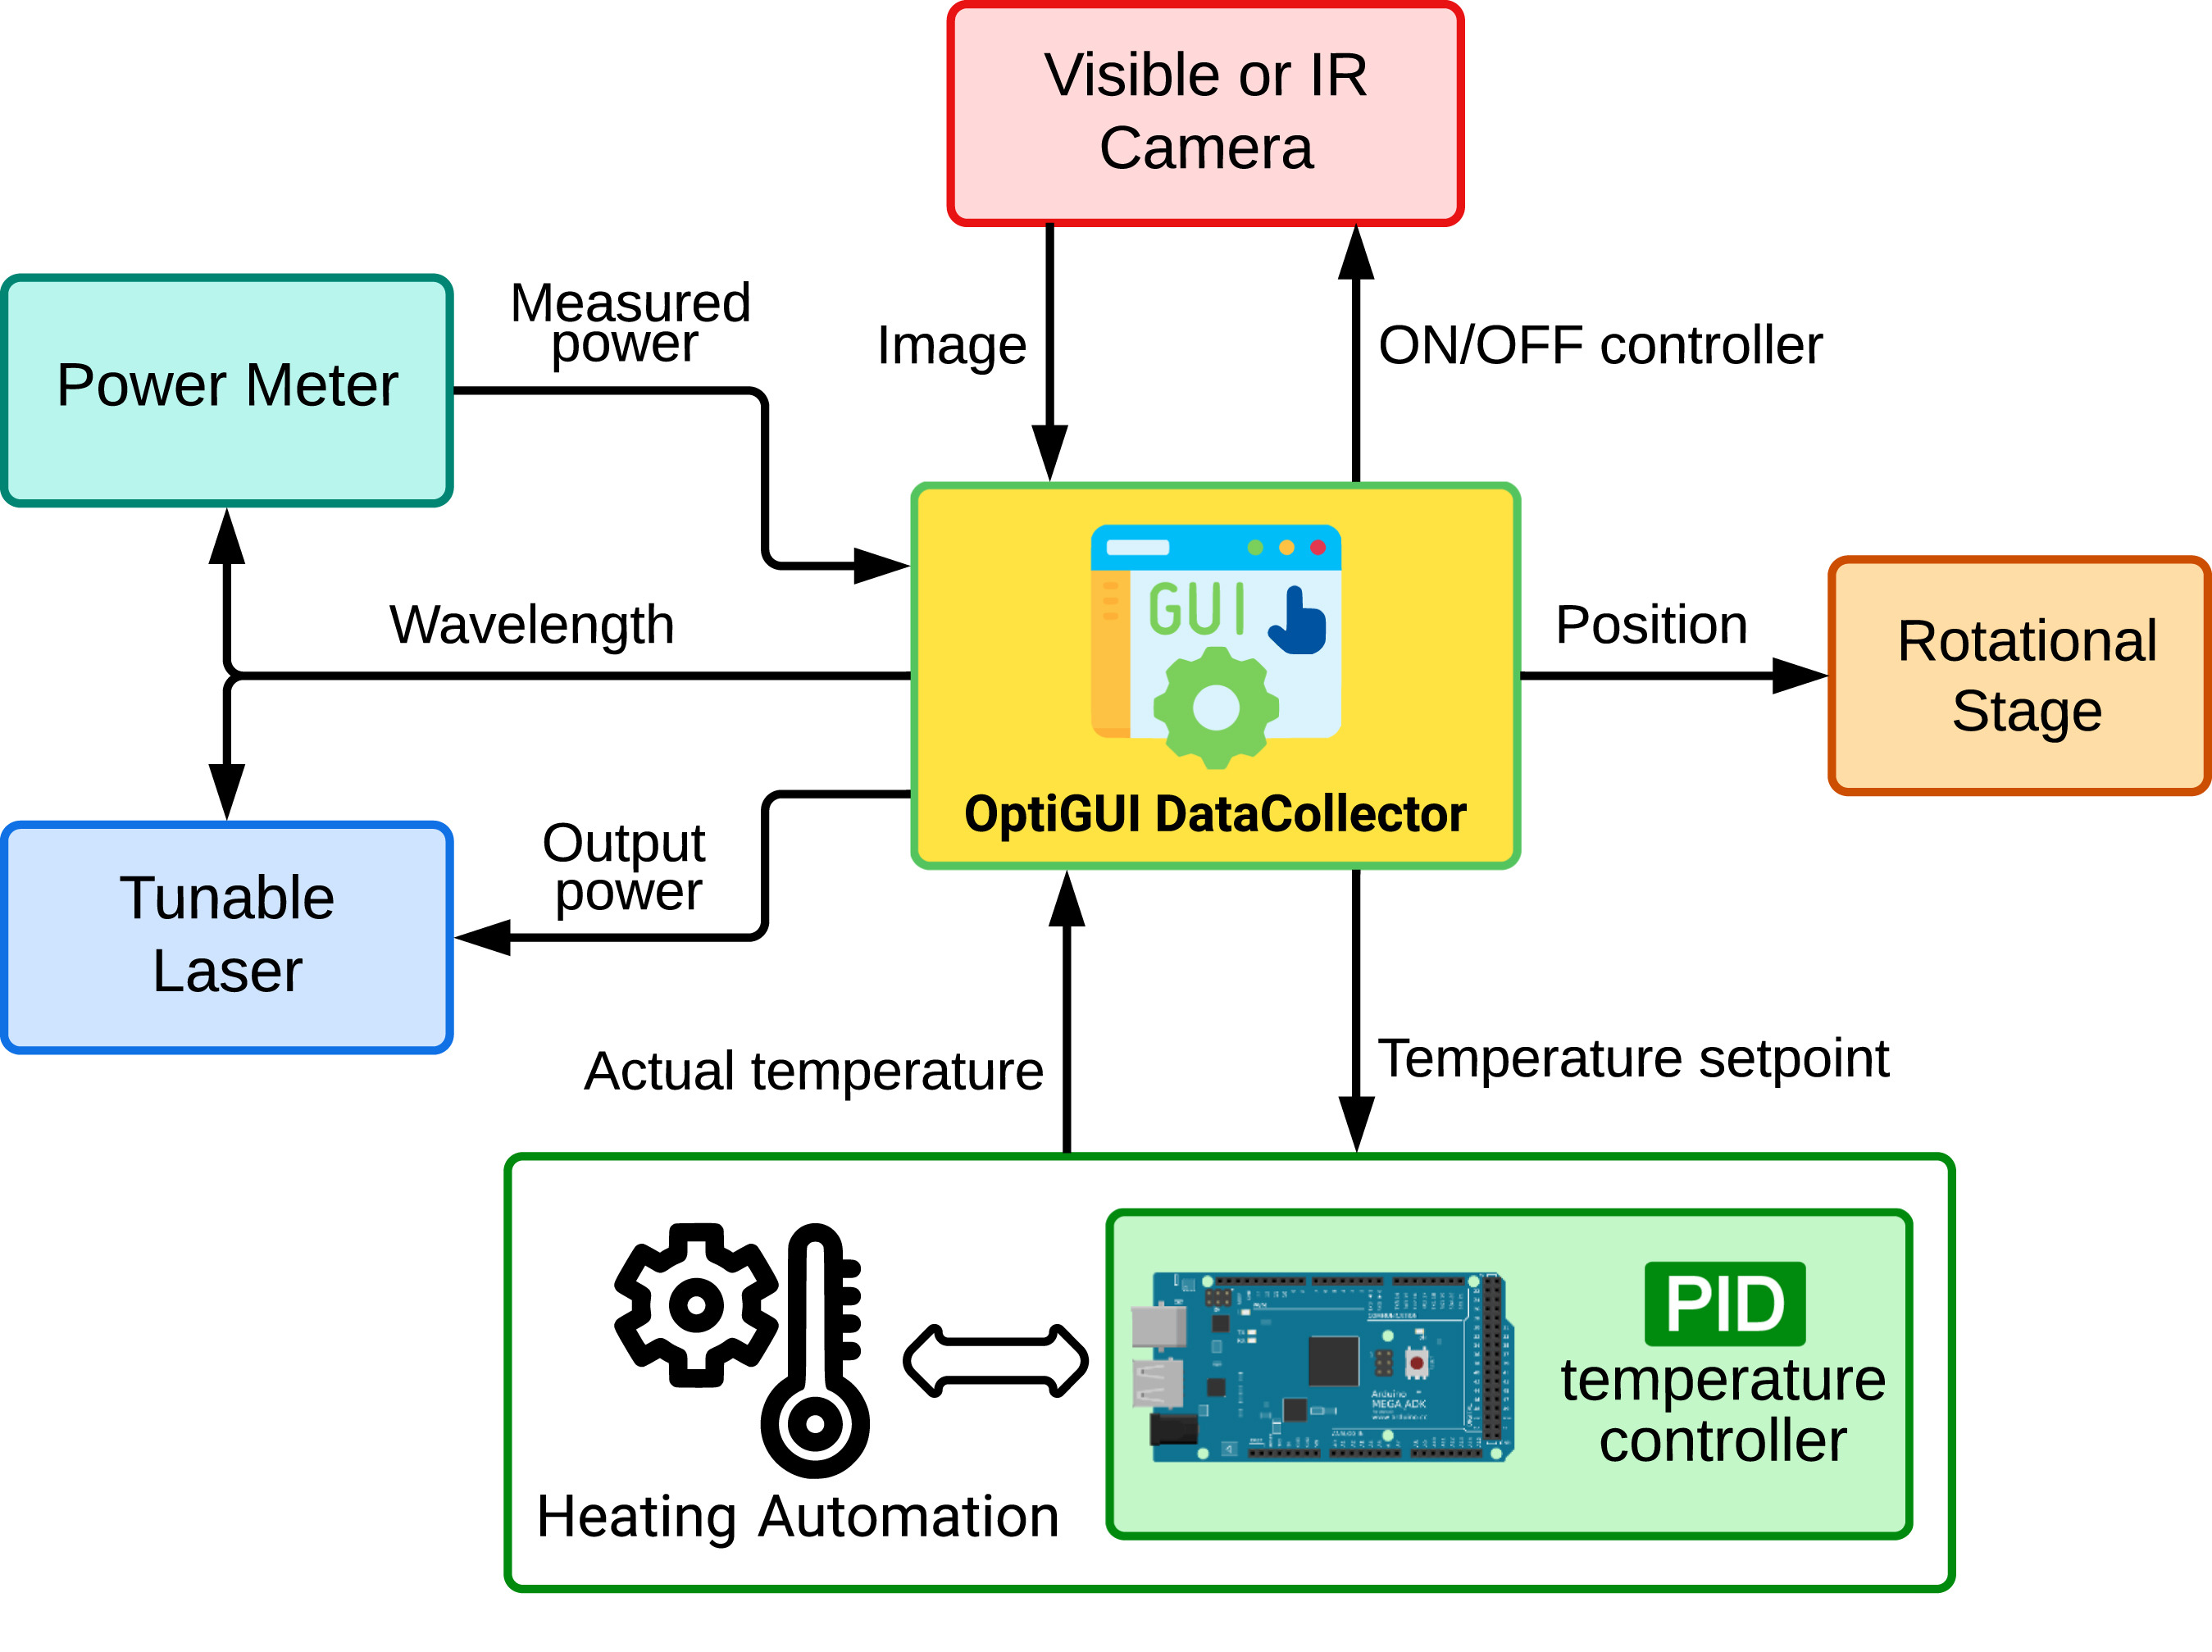
OptiGUI DataCollector is a Python 3.8-based graphical user interface (GUI) that facilitates automated data collection in optics and photonics research and development equipment. It provides an intuitive and easy-to-use platform for controlling a wide range of optical instruments, including [[spectrometer]]s and lasers. OptiGUI DataCollector is a flexible and modular framework that enables simple integration with different types of devices. It simplifies experimental workflow and reduces human error by automating parameter control, data acquisition, and [[Data analysis|analysis]]. OptiGUI DataCollector is currently focused on optical mode conversion utilizing fiber optic technologies ... ('''[[Journal:OptiGUI DataCollector: A graphical user interface for automating the data collecting process in optical and photonics labs|Full article...]]''')<br /> | |||
''Recently featured'': | ''Recently featured'': | ||
{{flowlist | | {{flowlist | | ||
* [[Journal: | * [[Journal:Ten simple rules for managing laboratory information|Ten simple rules for managing laboratory information]] | ||
* [[Journal: | * [[Journal:Hierarchical AI enables global interpretation of culture plates in the era of digital microbiology|Hierarchical AI enables global interpretation of culture plates in the era of digital microbiology]] | ||
* [[Journal: | * [[Journal:Critical analysis of the impact of AI on the patient–physician relationship: A multi-stakeholder qualitative study|Critical analysis of the impact of AI on the patient–physician relationship: A multi-stakeholder qualitative study]] | ||
}} | }} | ||
Latest revision as of 15:05, 17 June 2024
OptiGUI DataCollector is a Python 3.8-based graphical user interface (GUI) that facilitates automated data collection in optics and photonics research and development equipment. It provides an intuitive and easy-to-use platform for controlling a wide range of optical instruments, including spectrometers and lasers. OptiGUI DataCollector is a flexible and modular framework that enables simple integration with different types of devices. It simplifies experimental workflow and reduces human error by automating parameter control, data acquisition, and analysis. OptiGUI DataCollector is currently focused on optical mode conversion utilizing fiber optic technologies ... (Full article...)
Recently featured:


