Difference between revisions of "User:Shawndouglas/sandbox/sublevel4"
Shawndouglas (talk | contribs) |
Shawndouglas (talk | contribs) |
||
| Line 22: | Line 22: | ||
|pages = 67–81 | |pages = 67–81 | ||
|doi = [http://10.5194/gi-7-67-2018 10.5194/gi-7-67-2018] | |doi = [http://10.5194/gi-7-67-2018 10.5194/gi-7-67-2018] | ||
|issn = | |issn = 2193-0864 | ||
|license = [http://creativecommons.org/licenses/by/4.0/ Creative Commons Attribution 4.0 International] | |license = [http://creativecommons.org/licenses/by/4.0/ Creative Commons Attribution 4.0 International] | ||
|website = [https://www.geosci-instrum-method-data-syst.net/7/67/2018/ https://www.geosci-instrum-method-data-syst.net/7/67/2018/] | |website = [https://www.geosci-instrum-method-data-syst.net/7/67/2018/ https://www.geosci-instrum-method-data-syst.net/7/67/2018/] | ||
Revision as of 15:45, 18 August 2018
|
|
This is sublevel2 of my sandbox, where I play with features and test MediaWiki code. If you wish to leave a comment for me, please see my discussion page instead. |
Sandbox begins below
| Full article title | CÆLIS: Software for assimilation, management, and processing data of an atmospheric measurement network |
|---|---|
| Journal | Geoscientific Instrumentation, Methods and Data Systems |
| Author(s) | Fuertes, David; Toledano, Carlos; González, Ramiro; Berjón, Alberto; Torres, Benjamin; Cachorro, Victoria E.; de Frutos, Ángel M. |
| Author affiliation(s) | University of Valladolid, GRASP SAS |
| Primary contact | Email: david at goa dot uva dot es |
| Editors | Vazquez, Luis |
| Year published | 2018 |
| Volume and issue | 7(1) |
| Page(s) | 67–81 |
| DOI | 10.5194/gi-7-67-2018 |
| ISSN | 2193-0864 |
| Distribution license | Creative Commons Attribution 4.0 International |
| Website | https://www.geosci-instrum-method-data-syst.net/7/67/2018/ |
| Download | https://www.geosci-instrum-method-data-syst.net/7/67/2018/gi-7-67-2018.pdf (PDF) |
|
|
This article should not be considered complete until this message box has been removed. This is a work in progress. |
Abstract
Given the importance of atmospheric aerosols, the number of instruments and measurement networks which focus on its characterization is growing. Many challenges are derived from standardization of protocols, monitoring of instrument status to evaluate network data quality, and manipulation and distribution of large volumes of data (raw and processed). CÆLIS is a software system which aims to simplify the management of a network, providing the scientific community a new tool for monitoring instruments, processing data in real time, and working with the data. Since 2008, CÆLIS has been successfully applied to the photometer calibration facility managed by the University of Valladolid, Spain, under the framework of the Aerosol Robotic Network (AERONET). Thanks to the use of advanced tools, this facility has been able to analyze a growing number of stations and data in real time, which greatly benefits network management and data quality control. The work describes the system architecture of CÆLIS and gives some examples of applications and data processing.
Introduction
Atmospheric aerosols are defined as solid or liquid particles suspended in the atmosphere. Many studies have shown the importance of aerosols, which play an important role in global energy balance and human activities. Among their direct impacts, aerosol particles produce radiative forcing in the atmosphere, provide nutrients for oceans, and affect human health. Aerosols generally produce a cooling effect, although an aerosol can also locally warm up the atmosphere depending on its type, height above the surface, and timescale under consideration. Indirectly, they change the chemical composition of clouds and therefore their radiative properties, lifetime, and precipitation. Improving knowledge about the distribution and composition of aerosols is one of the emerging challenges highlighted by the last IPCC report[1], where it is shown that they have the largest uncertainty for the estimates and interpretations of the Earth’s changing energy budget.
Ground-based and orbital instruments have been applied to monitor aerosol properties. Combining instruments is also possible to maximally exploit synergies. For example, satellites have demonstrated the potential of high spatial coverage and resolution, and standardized ground-based networks have the benefit of high accuracy. A common exercise is to validate satellite data with ground-based networks.
One of these ground-based networks is the Aerosol Robotic Network (AERONET).[2] Led by NASA (National Aeronautics and Space Administration; http://aerosnet.gsfc.nasa.gov) and PHOTONS (PHOtométrie pour le Traitement Opérationnel de Normalisation Satellitaire; http://loaphotons.univ-lille1.fr/), AERONET is built as a federation of sub-networks with highly standardized procedures: instrument, calibration, processing, and data distribution. It was created in the 1990s with the objective of global monitoring of aerosol optical properties from the ground, as well as validating satellite retrievals of aerosols. The standard instrument used by the network is the photometer Cimel318. It is an automatic filter radiometer with a two-axis robot and nine spectral channels covering the spectral range of 340 to 1640 nm. It collects direct solar and lunar measurements, sky radiances in the almucantar and principal planes, and hybrid geometrical configurations. Once the data are validated through instrument status and cloud screening, aerosol optical depth (AOD) can be obtained as a direct product of the nine wavelengths. Using inversion algorithms[3][4], many other parameters can be retrieved, such as size distribution, complex refractive index, portion of spherical particles, and single-scattering albedo.
The Group of Atmospheric Optics at Valladolid University (GOA), Spain, is devoted to the analysis of atmospheric components by optical methods, mainly using remote sensing techniques such as spectral radiometry and lidar. One of the main tasks of the group is the management of an AERONET calibration facility since 2006, which is now—together with the University of Lille, France, and the Spanish Meteorological Agency—part of the so-called Aerosol Remote Sensing central facility of the Aerosols, Clouds, and Trace gases Research Infrastructure (ACTRIS). Since 2016, ACTRIS has been included in the road map of the European Strategy Forum for Research Infrastructures (ESFRI). The GOA calibration facility is in charge of the calibration and site monitoring of about 50 AERONET sites in Europe, North Africa, and Central America.
AERONET standards call for annual instrument calibration, maintenance, and weekly checks on the observation data. The calibration process takes about two to three months and includes post-field calibration for sun, moon, and sky channels; maintenance of the instrumentation; and pre-field calibration for the next measurement period. In order to avoid gaps in the data sets during calibration periods, frequently one instrument is swapped out with a freshly calibrated one. The network management determines where each instrument is located, what its exact configuration and calibration coefficients are, and how many days remain until the next calibration is needed. During the regular deployment period the instrument has to be regularly checked to guarantee the data quality. A routine maintenance protocol is performed by the site manager, but the network is ultimately responsible for data quality. The routine maintenance helps in reducing instrument failure and data errors, but even with the best daily protocol, instrumentation problems may occur. Data monitoring at the calibration center helps in early identification of instrument issues. However such work cannot be accomplished manually in near-real time (NRT) for a large number of sites.
In this context, it was necessary for the calibration facility at GOA to implement an automatic mechanism (in addition to the standard mechanism of AERONET) to help manage the network and facilitate weekly data checks needed to guarantee the quality of the data. The motivation of the CÆLIS system is to fulfill these two requirements. The system has to be designed to save all data, metadata, and ancillary data (assimilated from other sources) in order to, on the one hand, support the management, maintenance and calibration of the network, and on the other hand, process the raw data in NRT with different algorithms and provide network managers, site managers and ultimately the scientific community with a very powerful and modern tool to analyze data produced at the observation sites. This work shows the fundamentals of the CÆLIS system—developed since 2008—both with respect to the scientific background and the information technology employed. There was no predecessor software at Valladolid, and these tasks were done manually before CÆLIS was developed. The other two AERONET calibration centers at NASA and University of Lille have their own tools. Some ideas implemented in CÆLIS are inspired by these tools.
General architecture
CÆLIS has been designed to run on a server which, connected to the internet, allows for external communication via a web interface. The software contains a “daemon” (a background process that offers a service) which is responsible for selecting and launching tasks. These tasks, later explained, are responsible for downloading new data whenever available and processing them. Each task reads the required input information from the database and writes the output there. Some tasks use direct internet access to retrieve data, e.g., downloading ancillary data from an FTP server. All information downloaded and treated by CÆLIS tasks is stored in the database. This allows for following actions to retrieve all information required from the database (quick extraction).
External users (organized by role with various privilege levels) can connect through the web interface to watch what tasks are being executed and explore the results of finished tasks. All actions required by the system administrators can easily be done through the web interface. Network management is also performed through the web interface, which allows for, for example, setting up the installation of an instrument at a measurement station. The same information will be used by the system when data from the instruments reach the server, and CÆLIS will compare the received information (instrument number, parameters, location, dates, etc.) with reference registers stored in the database (installation periods, configuration parameters, etc.) to know if the instrument is working properly and using the correct configuration.
External systems, such as measurement stations, can also be connected to the server and submit data. Thanks to the web interface, it can be done using port 80 (standard HTTP), which avoids many problems derived from security rules of the measurement stations and hosting institutions (some of which are in military areas).
The current system manages 120 users and 80 stations. Each station can send thousands of aerosol observations every year, and the system is constantly growing. A benchmark has been applied to confirm that the current architecture can support a network 100 times bigger, so the database can grow safely in the future.
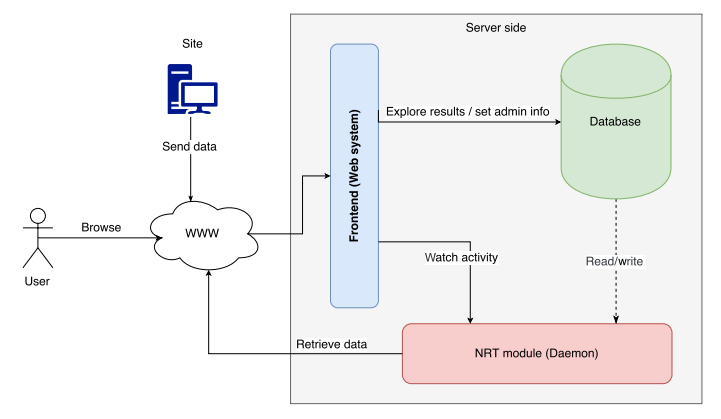
As shown in Fig. 1, CÆLIS is composed of a database, a processing module and a web interface. These modules can be deployed independently even in different computers. The users and the stations interact with the system through the web interface. In the database, the raw data and metadata are stored, as well as the retrieved products, ancillary data, user information, etc. The NRT processing module is composed of the system daemon and a set of processing routines that extract information from the database, calculate products, and store them in the database. The web interface is the platform designed to manage the system, to manage the network, and to provide visual access to the data and metadata, with tables, plots, searching capability, etc. Each of these elements will be explained in detail in the next sections.
|
Database model
Databases are one of the main concepts developed in the 1980s in the computer sciences. Many different approaches in terms of technology and data models have been developed with varying success. There are many types of databases, classified based on their characteristics. A database management system (DBMS) is software with an interface to a database system that provides the user with advanced characteristics such as the management of concurrency or a query language. The decision about what kind of database and which specific DBMS software to select is one of the main design decisions because all further development will be impacted by it.
Relational databases are a traditional and well-known model, and they have been successfully applied to many different fields. With relational databases, the information is organized in tables or relations which represent entity types.[5] A good database modeler is able to identify those entity types that are relevant with the information that describes them. The tables or relations are composed of columns with the attributes that describe them, and rows which represent different individual entities that are identified by an unique key (one or more attributes that cannot be repeated in different rows). The tables are linked, creating a relational model. The keystone of a database is good design, which needs to take into account the information targeted for modeling as well as the way in which the data is going to be accessed (to optimize performance). Complex models with many groups of entities need to be planned in advance by creating an entity–relationship diagram. This diagram then helps final implementation of the database, which can be a direct translation of the diagram just taking some implementation decisions about a balance between data redundancy and performance.
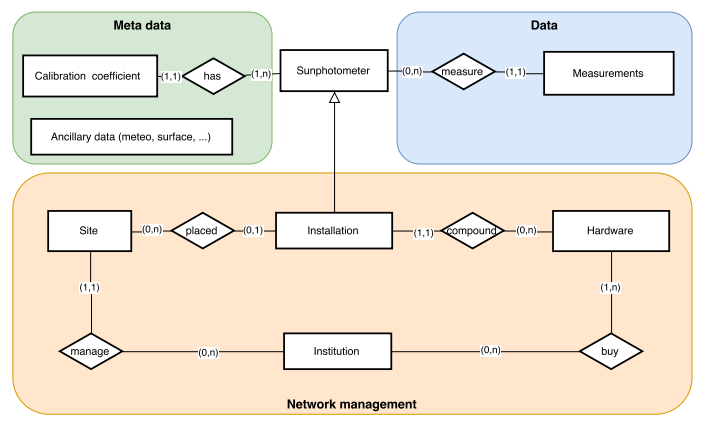
The main elements of the entity–relationship diagram of the CÆLIS database are shown in Fig. 2. The central entity is the photometer, which produces raw data. The photometer, with given hardware configuration and calibration coefficients, is installed at one site of the network. The ancillary data for the site (e.g., meteorological data, ozone column, and surface reflectance) need to be stored. Finally the measurement stations are supported by institutions, which can also own other instruments.
|
Each of these elements is in many cases representing a group of entities. For instance, calibration coefficients include extraterrestrial signal for the different solar spectral channels, radiance calibration coefficients for sky channels, coefficients for temperature correction of the signals, instrument field of view, etc. Another example is the hardware, which includes the different parts (sensor head, robot, collimator, control box, etc.), the spectral filters with the corresponding filter response, and others.
The lower part of the diagram is closely related to the network management, with an inventory of all hardware parts identified with their serial numbers and related to the institution that owns them. The upper part is related to the raw data production, and its organization is optimized for data extraction (to create products) and is consistent with the physical meaning and relevance of the quantities. The installations are manually introduced by the network managers so that any data file submitted to the system from a measurement station can be validated.
Other tables contain ancillary information that is needed to process data, such as the list of stations (including coordinates), global climatologies for certain atmospheric components (ozone, nitrogen dioxide, etc.), solar and lunar extraterrestrial irradiance spectra, and spectral absorption coefficients for several species (ozone, NO2, water vapor, etc.).
Many different DBMS can be used to implement such a model: OracleDB, SQLite, PostgreSQL, etc. CÆLIS is based on a MySQL database. MySQL software is widely used by many different communities. Therefore the software is very robust, complete, stable and well documented, and it can be run in many different architectures.
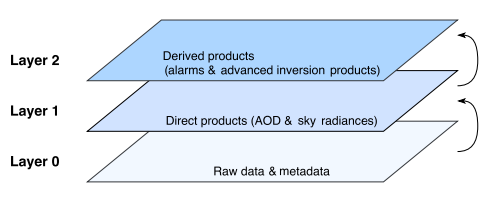
The entity–relationship diagram for CÆLIS, illustrated using the model defined by Chen[5], is shown in Fig. 2. This diagram shows the fundamental part of the database, called layer 0. On top of that, direct products—obtained with the combination of raw data, calibration coefficients, and ancillary data—are stored. This represents “layer 1” products, physical quantities with their corresponding units and estimated uncertainties (derived from the calibration uncertainties). In our case, these products are basically aerosol optical depth, water vapor content, sky radiances, and degree of linear polarization of the sky light. On top of layer 1, there are more sophisticated products, like those derived from inversion algorithms, as well as any flags or “alarms” that are produced to help in NRT data quality control.
Layer 2 products use and combine previous layer quantities to retrieve other parameters, but no longer go down to the raw data. For instance, the inversion codes by Dubovik and King[3] and Nakajima et al.[6] use spectral aerosol optical depth and sky radiances to retrieve aerosol particle size distribution, refractive indices, single-scattering albedo, etc. More advanced products that combine photometer data with other aerosol data (e.g., lidar) also belong to this group, named “layer 2” products. A clear example is the GRASP algorithm[7] (http://www.grasp-open.com/), which is able to digest data from different sensors (satellite and ground-based, active or passive) to provide a wide set of aerosol and surface parameters. The system architecture as described here is shown in Fig. 3.
|
Processing chain and near-real-time module
CÆLIS system provides many different data products. To provide each product, some input data has to be processed in a specific way. This is what we call a “task.” The job is divided into a set of simple tasks. The system works as a state machine: one task cannot start until the previous one is finished, no matter if the second task is dependent on or independent of the previous one. When many tasks work sequentially to achieve a common objective, we create a chain of tasks. The daemon running on the server is responsible for coordinating the different tasks, as it will be explained in the next section.
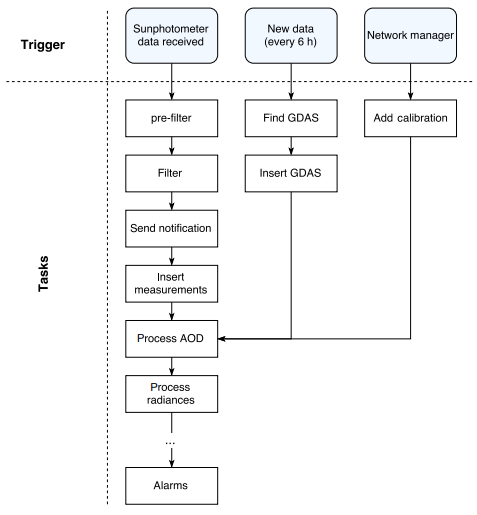
The main processing chain in CÆLIS is the set of the tasks that are performed once new photometer data are uploaded into the system, as shown in Fig. 4.
|
The pre-filter checks that the file uploaded to the server is a valid data file pertaining to the AERONET instruments managed by CÆLIS. If this is true, the “filter” checks that the basic information (instrument number, coordinates and dates, configuration parameters) is in accordance with the stored information about instrument installations. If any of these parameters do not correspond to its expected value, the data file is put to quarantine and the network managers receive an email notification (“send notification”). If all parameters are correct, the measurements are inserted in the database and the data file is forwarded to any desired destination: our data file repository, an AERONET server at NASA, etc. With the raw measurements inserted in the database, the processing of layer 1 products is triggered: the aerosol optical depth, water vapor, and radiances in several geometries (almucantar, principal plane, etc.). With all raw data and layer 1 products, a set of flags concerning data quality control are produced by the alarms task. These flags are produced in near-real time, as soon as new data are submitted to CÆLIS from a particular site. Since the automated quality control (QC) analysis needs all available information, the alarms task is always the last one in the processing chain. The QC flags in near-real time are a very important element in the network management. More details are given in a later section "Examples of application."
Any new implementation, for instance a new layer 1 product, needs to be inserted in the processing chain, taking into account its dependency on any other elements in the chain. The last step in a certain task is to trigger the next one in the chain.
Whenever new data are found (photometer, ancillary, other) or new information is inserted by the managers (new calibration, installation, etc.), a processing chain is triggered. The management of all chains in CÆLIS is carried out by the daemon, which is explained in detail in the next section. This kind of task organization is highly modular, so new elements in CÆLIS—either data or different instruments—can be added by creating new chains that can be connected or not to the existing ones.
The near-real-time processing module (see Fig. 1) is composed of a set of programs and libraries that are related to all the above mentioned tasks. These are programmed mainly in C for fast computation with large data sets and interoperability with other technologies, allowing for the use of other languages in the future. A Git repository is used to facilitate version control and deployment of the software.
Daemon
The daemon is responsible for organizing the tasks and deciding which process has to be run in each moment. It has to address different challenges, including:
- running scheduled tasks according to their priority;
- knowing which task must trigger other tasks;
- maintaining the sequence; and
- optimizing the server processing capability and running less important tasks when the CPU is idle.
The tasks are stacked in the system. Figure 5 is a representation of the stack of the tasks, where the green tasks are actions that can be executed right now and the red tasks are disabled until the “activation time” arrives.
|
Each task is described by the following information:
1. Group: classification of the task 2. Name: name of the task 3. Object: if it exists, defines the target where the task will be applied (for example, one file, one particular instrument, one site) 4. Date range: if defined, task can be applied to a specific time range 5. Date/time of activation: designates when the task can be run (note that some tasks can be defined to be executed in the future) 6. Priority: defines the importance of the task
Frequently, several tasks can be activated at the same moment. In these cases, the priority flag indicates to the system the order in which the tasks should be run. At the same time, the processing chains (commented in Fig. 4) used this mark to indicate the order of the tasks to the daemon. When a task is executed, if it is part of a chain, it will introduce the next actions in the stack (sorted by priority). This is the procedure to keep the system alive and always working.
In every moment, the stack contains the current tasks that can be executed right now, as well as the tasks that are scheduled to be run in the future. This is the method used by the system to repeat tasks: if a task is intended to be repeated every 15 minutes, once it is executed, the system will remove it from the stack but will add it again with the activation time set to 15 minutes later.
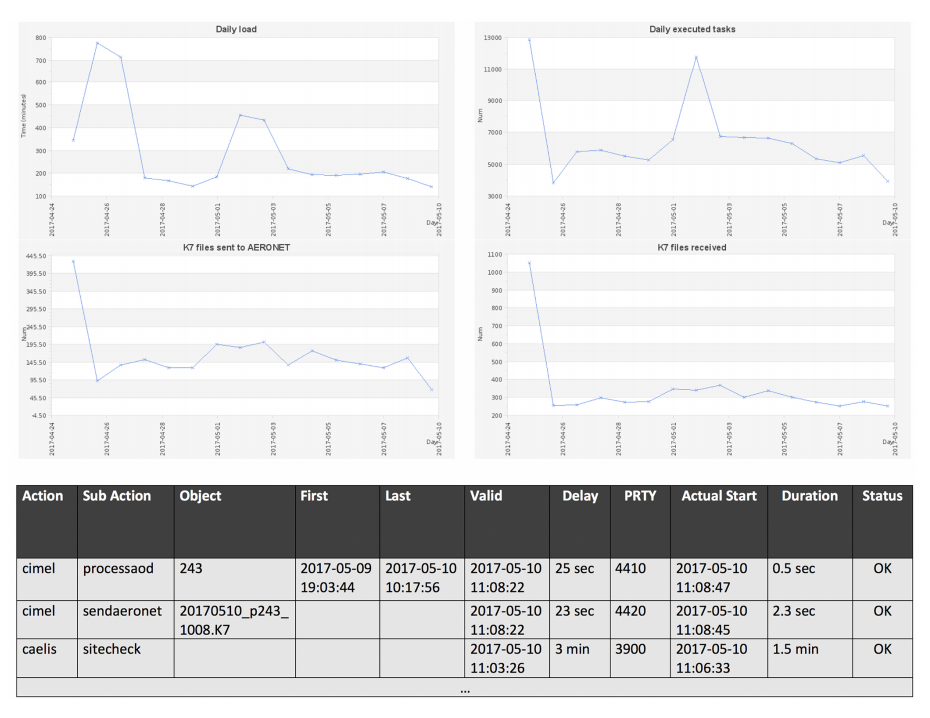
After a task is executed, the information on the execution is saved into a log. This allows the system administrator to study the behavior of the system, to know what has been executed, to foresee the future use of the system, and to tune the parameters of CÆLIS to balance between NRT actions and the load of the system. Figure 6 shows the log of actions and their statistics. Thanks to the log and system statistics, the system administrators can know how much time a specific task takes every day and how many times each task is executed. This information is crucial for system administrators and developers because they can analyze which tasks take more time and why (in the cases when a defined task is too slow or is called many times, etc.) and create plans to optimize the system.
|
In a regular situation, the system works automatically. For instance, when the daemon starts, the common operations are introduced in the stack of tasks. One of these common operations will look for new data and metadata with a certain frequency (e.g., once per hour). Then, if new data are found by the corresponding task, it will add new tasks to process those data, triggering the processing chain. If there are no new data, the task will add the same task to find new data some minutes later.
The system administrators can add tasks manually and they can change the priority of the current tasks in the stack. One of the main manual tasks that the administrator can add is the “stop” action. The stop action has a duration of a few seconds and, once it finishes, it re-enters itself in the stack. This process continues until the administrator erases the task manually from the stack. Depending on the priority assigned to the stop action, the system can be completely blocked or it can allow some tasks with high priority to be undertaken. Another main action is to shut down the system. If the system administrator wants to shut down the daemon, this task should be introduced. This guarantees that the system is turned off when idle and no task is interrupted abruptly.
The system is also prepared for a sudden shutdown (for example, power outage). Given that the system only removes the tasks from the stack when they are finished, once the server is turned on, the first task to be executed will be the one that could not be completed. The fact that all these scenarios are taken into account by the stack of tasks makes CÆLIS a robust system and easy to maintain.
The system executes maintenance tasks regularly. For example, a daily backup is performed. This task is scheduled every night thanks to activation time information. The maintenance tasks can cover many different activities that need to be done regularly in the system. Other examples of maintenance tasks include the optimization of the database and regular re-booting.
The current implementation of the daemon is developed using bash scripts. This characteristic allows running tasks written in any language. It is planned to improve the current implementation by using Python and to introduce parallelism into the task chain. If this has not yet been undertaken, it is due to the relatively low load of the system. Processing in sequential mode is still sufficient to provide data in NRT. When more sophisticated algorithms will be run (such as inversion retrieval algorithms), a new implementation of the daemon will be needed. Alternatively, tasks can be launched in a server farm, allowing the system to only organize tasks while keeping its load very low. The tasks are currently implemented mainly in C because of its high performance, but any language that compiles is allowed on the server.
Web tool
CÆLIS offers users a web interface (http://www. caelis.uva.es). The web interface is a high-level view of the data model, and thus it shows information in real time, as soon as it is processed. The web system is secured with private access, only for registered users. During the registration process, a “role” is assigned to each user. The roles allow identifying groups of users with different permissions into the system, for example, regular users (site managers or researchers) that can access its data or a system administrator that can handle the stack of tasks of the system or reboot it.
The web interface provides high-level access to the database. It can extract and relate different data and show them all together as an online real-time report. CÆLIS has implemented many different use cases which are sufficient for common user actions. The system offers different tools depending on the role of the user. For example, a site manager can check the performance of one instrument, a network manager can modify the location of an instrument, and a system administrator can check the tasks that the NRT module is executing. The web interface allows the user to explore the database showing tables and customized plots. Some of these use cases are described below in the example section.
The web interface also allows one to query information, as well as insert new information. This is especially interesting because it constitutes the second way to insert data into the system: data inserted by the users (data can also be registered by the tasks controlled by the daemon; see previous section). In the case of users, since they work via web interface, the actions can be controlled in two senses: (1) the user has the permission to introduce the information, and (2) the information introduced is validated. Moreover, the fact that manual information is registered by means of the web interface allows the system to launch “derived tasks” for an specific action. For example, when a new measurement site is created, the system can add the action of “insert climatology data for the new coordinates.” Everything is triggered automatically and controlled by the logic implemented in the web interface.
The web interface has been developed using PHP through the Symfony framework, Bootstrap as the CSS framework, and jQuery as the JavaScript framework (used for asynchronous actions and to make the interface more dynamic). The choice for PDO (PHP Data Object) is Propel. Every technology selected in development has been highly studied:
- PHP is a widely developed language for web development. It shows very good performance, and popular websites have been developed using it. It also has a large community behind it, which offers helpful support. The ecosystem (libraries implemented to be used with PHP) is one of the best for web computing and includes libraries for graphical representation, mathematics, etc.
- Symfony framework at present is for quick development, though this framework is also designed for heavy development. This allows developers to stay focused on main issues and reduce the complexity of common tasks: user management, database access, etc. The selection of Symfony over other alternatives was because it became very popular at the moment web interface development began and the community was very active. Moreover, it is easy to use, contains hundreds of libraries, is powerful and flexible, and it performs well.
- JavaScript is used for asynchronous connections with the server in order to offer a very dynamic interface. JavaScript is undisputedly the best for this purpose.
- jQuery is used as a JavaScript framework. There are alternatives, but jQuery is very well integrated with Symfony, it is widely used, and it fulfills all system requirements.
- Propel was selected for the PDO library because it allows one to have primary keys with multiple fields. The CÆLIS database has been deeply optimized, and the use of multi-field primary keys greatly improves performance in comparison with an auto increment ID (common alternative). At decision time, only Propel managed such kind of keys.
The web interface has been structured and designed to grow, being able to add the management of other measurement networks or scientific projects. Those projects can share the core of the developed code. This allows one to start projects from existing code instead of starting from scratch, making it quick to add new features. For example, one of these common utilities is the plotting tool. CÆLIS has a very powerful and flexible tool to plot the data. The tool is implemented on the server side using PHP. The benefit of this approach is that, when plotting very huge pieces of data, the plotting is still quick since the data is not transferred to the client (the web browser). Instead, the plot is created in the server, and only some tens of kilobytes are transferred to the users. This solution is optimal for treating large pieces of information. A disadvantage of this approach is that the result is less dynamic than an implementation on the client side.
The web interface also implements web services for machine-to-machine communication. These web services allow one to perform common operations such as data transfer from the measurement sites to the server. A great advantage of this approach is that even well-secured external machines can connect to a HTTP server. In some cases, e.g., instruments installed in military bases, they need special permission to set up internal proxies and allow access to the system, but it is widely accepted that HTTP protocol on port 80 can be used everywhere. Alternatively, CÆLIS can offer other data transfer alternatives, such as FTP or email, but the most common is to use the web service.
Examples of application
In order to illustrate the capabilities of the system, we will now show a set of examples, focusing on the typical needs of the different users: site managers, network managers (calibration center), and researchers.
Site manager use case
Site managers are interested in knowing the status of their instruments and retrieving general information about the instruments and their sites. This example will illustrate how a site manager can access all this information.
CÆLIS offers access to all metadata related to each instrument: calibration coefficients, temperature corrections, configuration parameters, filters, etc. The metadata are in general different for each deployment period.
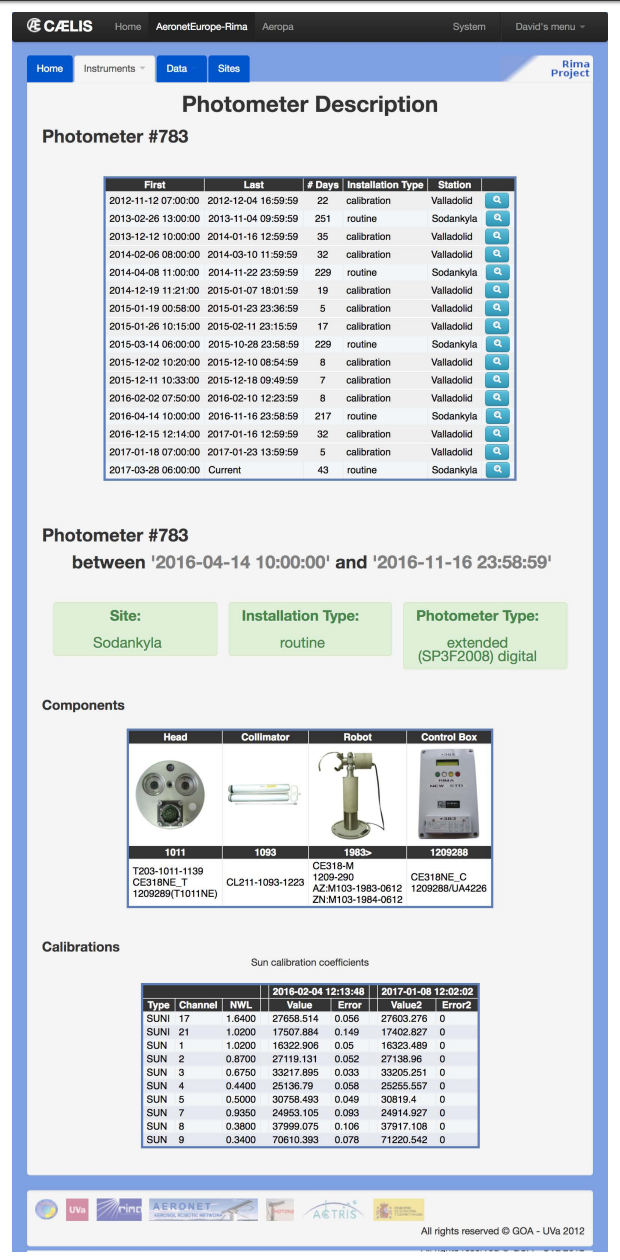
Figure 7 shows the description of the photometer #783 of the AERONET network (registered in CÆLIS and calibrated by GOA). There are three blocks of information: (1) metadata such as calibration coefficients or configuration, (2) network management information such as deployment periods (sites, dates), and (3) administrative information such as hardware inventory of all parts of the instrument.
|
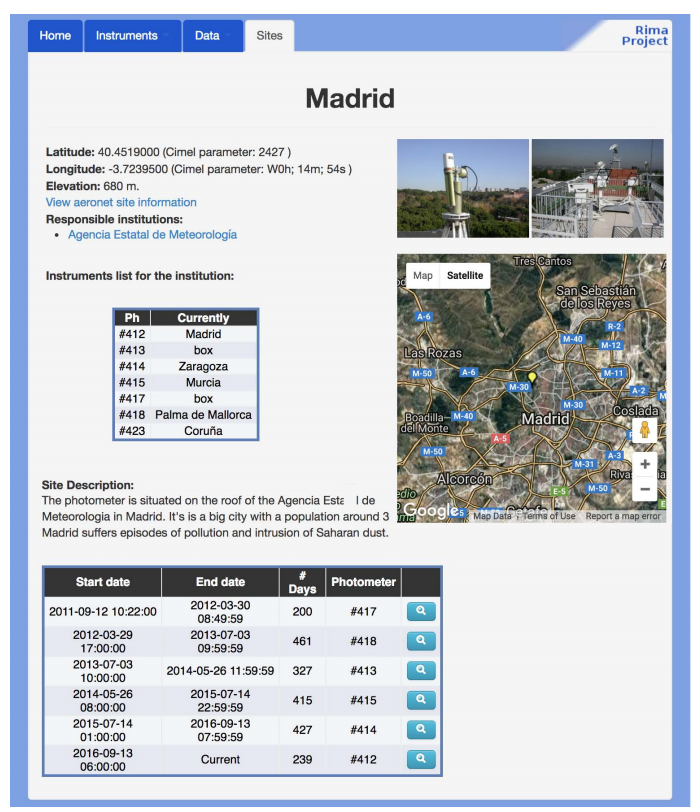
The continuity of the data sets is an important issue in AERONET. In order to avoid (or minimize) data gaps, often a calibrated instrument is sent to a site to replace an instrument that needs to be calibrated. Hence a number of instruments are rotating inside the network, from site to site. This fact makes it difficult to monitor which instrument is where. CÆLIS offers the information about each site, with the list of instruments and deployment dates in that particular site. This is all easily accessible to site managers.
The illustration in Fig. 8 shows the information of the measurement site placed in Madrid, Spain. Some general information is shown on top of the page, followed by the list of instruments and measurement periods. This information is linked with the instrument information showed in the previous figure so that it is very easy to browse all the information.
|
Network manager use case
One of the most important applications of CÆLIS is real-time data monitoring. This information is used by the network managers (as well as site managers), and it provides useful information about instrument performance. The biggest benefit of this powerful tool is that it allows identifying problems in the instrumentation as soon as they appear, raising a flag automatically. The network managers at the calibration center can send a warning to the site managers. If site managers can solve problems quickly, this is of great benefit to data quality and continuity, and thus network quality. The calibration center is continuously monitoring this information in order to warn and assist the site managers if a problem is not quickly solved.
When the system receives new data files from a measurement site, it processes the data, generating new products. From raw measurements it calculates the aerosol optical depth, sky radiances, and other products. The last product in the processing chain triggered by the arrival of new data is the alarms. This product studies the new data, metadata, and derived products in order to identify malfunctions in the instrumentation.
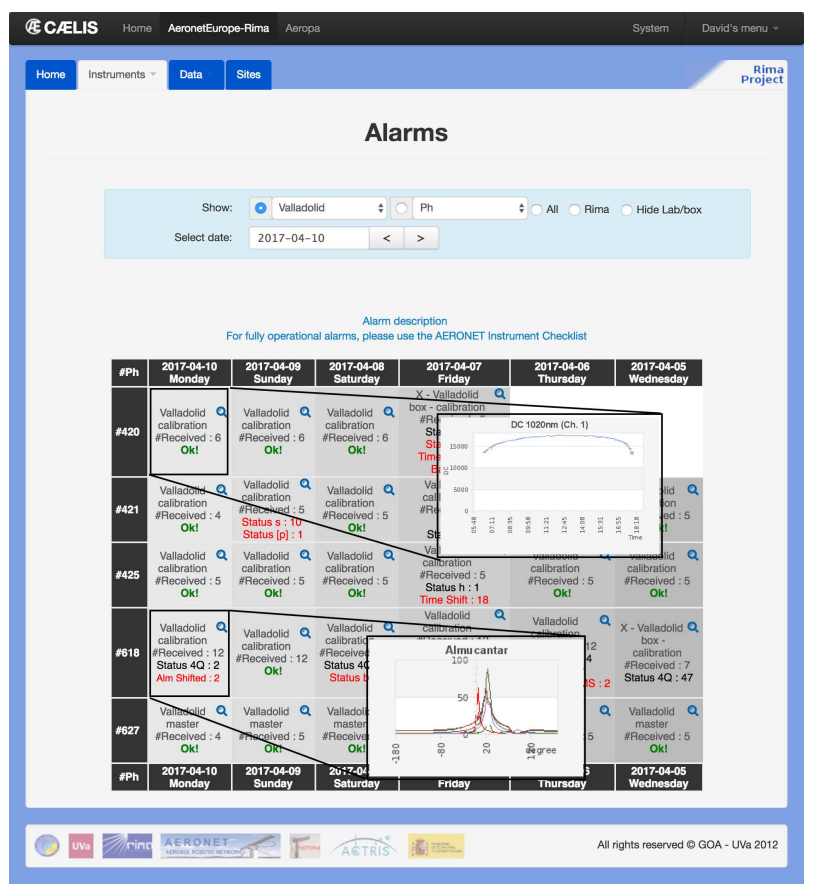
Figure 9 shows a screenshot of the CÆLIS web interface, where we can see the status of a specific site over six days (this is a calibration site so it has more than one instrument). This page can be customized thanks to filters (sites, instruments, dates, etc. ). Finally, useful information can be obtained by simply clicking on specific places. For example, when the photometer number is clicked, instrument status information is shown in graphs (battery voltage, internal temperature, etc.), and when a specific day is selected the user can explore all information (raw data, products) received and processed for that particular day.
|
Every day, calibration centers need to solve instrument issues and multiple questions, and this is only possible thanks to deep knowledge of the instrumentation. CÆLIS helps with routine problems and provides very useful information about the data contained in the database. In the case of new issues, the system offers a data viewer which allows one to customize the data to be displayed in a very flexible and powerful way.
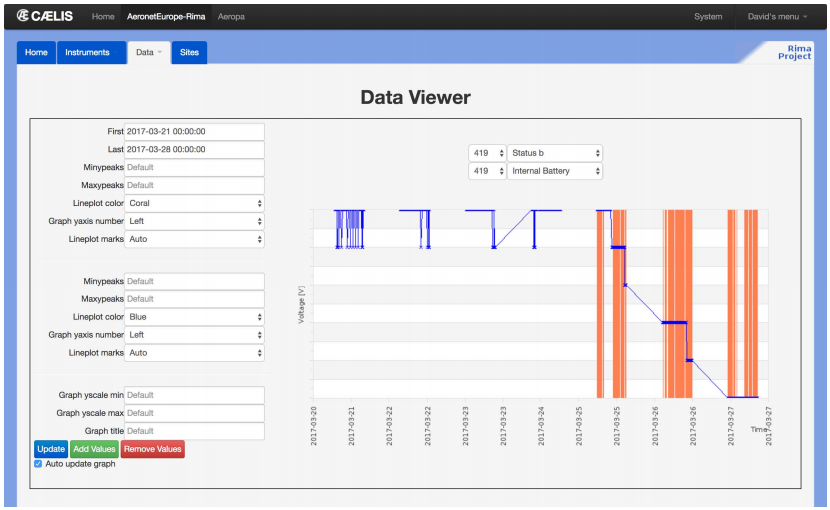
Figure 10 shows setting up a specific case in which data from different sources are shown in the same plot in order to help the network manager to understand the problem. We can select one or multiple variables (all available raw data and data products) from one or multiple instruments, and display them for a particular date/time range, with full flexibility in plot configuration (colors, axis, etc.). Specifically, the example shows battery voltage and robot errors. The plot clearly indicates that the power supply stopped working; therefore, the battery is losing charge and the robot cannot operate normally and returns robot errors coinciding with the decreasing battery voltage trend.
|
Research applications
The following example will show a specific project of the research group with the aim of studying the AERONET database. As part of this project, a relational database which organizes AERONET data was created. By querying this database the user can answer general questions about AERONET sites, including the following: since when has an AERONET site been active? How much data (and at what quality) does a site have? This project reuses at maximum the core of the system (user access, plot tools, etc.) and lets the developers create a new tool quickly. CÆLIS has been used as “framework” for data analysis. The effort required to develop this system is far less than starting from scratch. The features needed in this development are a tool to assimilate the new data and the specific views that show the results. Additionally, CÆLIS can re-use the database added here in other projects.
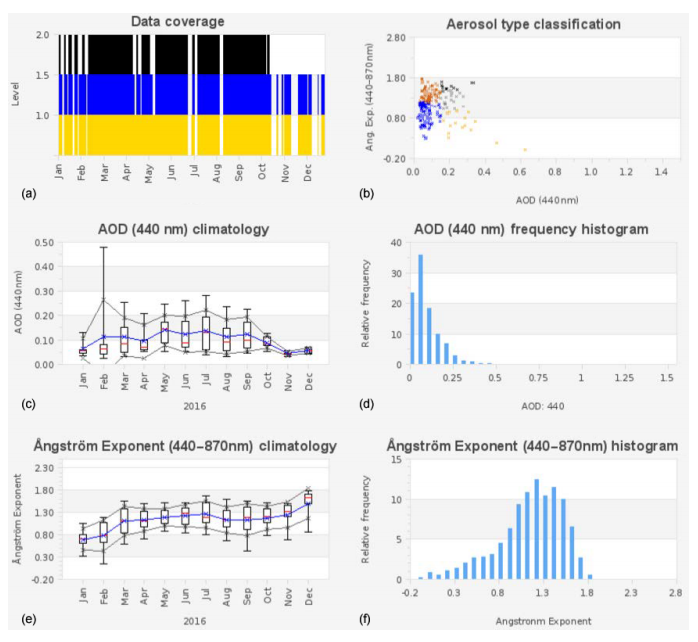
Figure 11 shows the automated aerosol data analysis of an AERONET site (Palencia, Spain). In it, we can see the data coverage (for level 1.0, 1.5 and 2.0 of the AERONET database), monthly statistics of aerosol optical depth and Ångström exponent, frequency histograms, and an AOD vs. AE scatter plot providing basic aerosol type classification. These plots provide a general overview of the site characteristics in terms of data coverage, aerosol statistics and type classification, which can be used as a first approach in order to select a site for some particular study. Then, based on this general information, the researcher can ask other questions that can be solved by interrogating the database directly.
|
In order to illustrate how it can be done, the next part of the example will show how to identify special aerosol events at the Palencia AERONET site. For this purpose, we need to explore the CÆLIS database. The starting point will be the following questions: how many days of high turbidity occur at the site? How many of these can be classified as desert dust events? To answer these questions we will use the previous (overall) climatology and we will make some assumptions. First, we are going to assume that “a high-turbidity event” takes place when the AOD average is larger than the climatological mean plus two standard deviations (SD). Based on that assertion, we can write an SQL query that is launched in the system database and will review every single value and return the result. To create this SQL query, it is important to have accurate knowledge of the database model in order to obtain the expected results and within a reasonable time. For our particular case, we will use the cml-aod table which contains the general information about each AOD measurement, and the cml-aod channel which contains AOD information about each specific wavelength channel. First, we check how many days with AOD measurements we have for the Palencia AERONET site:
SELECT COUNT (a. ‘date‘) FROM
‘cml-aod‘ a WHERE station =
'Palencia' GROUP BY DATE (a. ‘date‘)
—
Result = 2730
Now, we can filter this result by checking during how many days does the AOD (440 nm wavelength) have at least 10 observation points greater than 0.31 (climatological average = 0.13 and SD = 0.09):
SELECT DATE (a. ‘date‘)
FROM ‘cml-aod‘ a LEFT JOIN
‘cml-aod-channel‘ c
ON a. ‘ph‘ = c. ‘ph‘ AND
a. ‘date‘ = c. ‘date‘ WHERE
station = 'Palencia'
and c. ‘wln‘ = 0.44 and c. ‘aod‘ > 0.31
and cloud-screening-v2 = 'cloud-free'
GROUP BY DATE (a. ‘date‘) HAVING
COUNT(∗) > 10 ORDER BY DATE (a. ‘date‘)
—
Result 285 days: 12 February 2004,
14 February 2004, . . . , 14 March 2017
Finally, we make another assumption: a desert dust event must have a low Ångström exponent value, lower than the average minus two times the standard deviation (climatological average = 1.29, SD = 0.37):
SELECT DATE (a. ‘date‘)
FROM ‘cml-aod‘ a LEFT JOIN
‘cml-aod-channel‘ c
ON a. ‘ph‘ = c. ‘ph‘ AND
a. ‘date‘ = c. ‘date‘ WHERE
station = 'Palencia'
and c. ‘wln‘ = 0.44 and c. ‘aod‘ > 0.31
and a. ‘alpha-440-870‘ < 0.55
GROUP BY DATE (a. ‘date‘) HAVING
COUNT(∗) > 10 ORDER BY DATE (a. ‘date‘)
—
Result = 65
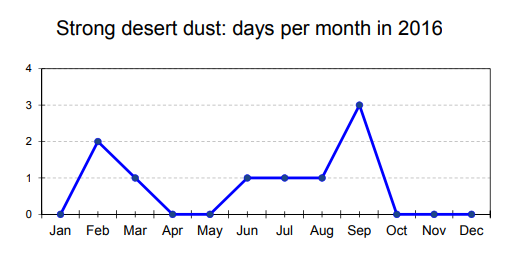
These are very strong conditions, which identify the most intense dust event days over the site. Finally, we will show for one selected year (2016), the number of dust event days per month as identified by our assumptions:
SELECT MONTH (‘date‘), COUNT(∗) FROM
(SELECT DATE (a. ‘date‘) AS ‘date‘
FROM ‘cml-aod‘ a LEFT JOIN
‘cml-aod-channel‘ c ON
a. ‘ph‘ = c. ‘ph‘
AND a. ‘date‘ = c. ‘date‘ WHERE
station = 'Palencia' AND YEAR
(a. ‘date) = 2016
AND c. ‘wln‘ = 0.44 AND c. ‘aod‘ > 0.31
AND a. ‘alpha-440-870‘ < 0.55
AND cloud-screening-v2 = 'cloud-free'
GROUP BY DATE (a. ‘date‘) HAVING
COUNT(∗) > 10
ORDER BY DATE (‘date‘)) dd GROUP BY
month (‘date‘)
The result is shown in Fig. 12, where we can see the two peaks of occurrence of Saharan dust episodes over Spain, i.e., February–March (early spring) and May–September, basically the summer months.
|
This example shows the flexibility and power of a relational database to make data analysis. Using SQL queries, very complex customized questions can be asked, and the data can be easily extracted from the database.
Summary and conclusions
Atmospheric aerosol particles are one of the most important contributors to the climate forcing uncertainty. They are currently extensively measured from ground and space, with very different techniques. It is therefore important to develop tools using modern technologies to monitor (quality control), process, analyze, and combine those data.
This paper has described the CÆLIS software tool, which has been developed for the management of the photometers that are calibrated and monitored by the calibration facility at the University of Valladolid, Spain, as part of AERONET. CÆLIS is intended to provide management for the photometer network, archive the data, and allow data analysis and research. Previous to the development of CÆLIS, these tasks were done manually. The use of this kind of advanced system has reduced the number of human errors and allowed one to perform more in-depth and exhaustive analysis. Thanks to CÆLIS, we are currently receiving and analyzing data from 80 sites, with a quality control system that provides flagging of the data in real time. This provides great benefits to the network management and allows immediate response to instrument malfunction.
The core of the CÆLIS system is built in a relational database. It stores user information (with its privileges), data, meta-data, etc. Around this database, different modules use it and offer different services: a web interface to explore the database and a NRT module to perform processing. All this software can be re-used for extending the system, for instance with other instrument types.
The construction of the database requires a balance between normalization and redundancy. The current system has three different layers of data. Layer 0 contains the raw data and the network management information, layer 1 contains direct products, and layer 2 contains advanced derived products that can be calculated. Each layer is based on the information of the previous one. A keystone of the system is to have a correct model of the first layer, i.e., normalized and without redundancy. This helps maintain the congruence of the system. Based on these data, other products can be developed. Depending on the use of these products, some redundancy may be necessary. For instance, pre-calculated products can allow for fast visualization in the web interface, which would be too slow if done on the fly.
The existence of redundancy implies that automated tasks are needed to maintain congruence. This is done by the NRT module, which organizes the actions in separated tasks. The NRT module is always running, thanks to a daemon which is based on a stack of tasks organized by priority, and that decides in every moment what must be done.
Users (site managers, calibration centers, researchers, etc.) can use the web interface for quick access and visualization of data. The relational database is shown to be an appropriate tool for research because it allows one to perform queries and extract data in a fast and very flexible way.
Acknowledgements
The authors gratefully acknowledge the effort of NASA to maintain the AERONET program. This research has received funding from the European Union’s Horizon 2020 Research and Innovation Programme under grant agreement no. 654109 (ACTRIS-2). The funding by MINECO (CTM2015-66742-R) and Junta de Castilla y León (VA100P17) is also acknowledged. We thank all the users of CÆLIS for their feedback, especially Emilio Cuevas, Carmen Guirado, and Roberto Román.
Data availability
All the research data used in this paper are publicly available on the AERONET website (https://aeronet.gsfc.nasa.gov/).
Competing interests
The authors declare that they have no conflict of interest.
References
- ↑ Intergovernmental Panel on Climate Change (2014). Climate Change 2013 – The Physical Science Basis: Working Group I Contribution to the Fifth Assessment Report of the Intergovernmental Panel on Climate Change. Cambridge University Press. doi:10.1017/CBO9781107415324. ISBN 9781107415324.
- ↑ Holben, B.N.; Eck, T.F.; Slutsker, I. et al. (1998). "AERONET—A Federated Instrument Network and Data Archive for Aerosol Characterization". Remote Sensing of Environment 66 (1): 1–16. doi:10.1016/S0034-4257(98)00031-5.
- ↑ 3.0 3.1 Dubovik, O.; King, M.D. (2000). "A flexible inversion algorithm for retrieval of aerosol optical properties from Sun and sky radiance measurements". Journal of Geophysical Research: Atmospheres 105 (D16): 20673-20696. doi:10.1029/2000JD900282.
- ↑ Dubovik, O.; Sinyuk, A.; Lapyonok, T. et al. (2006). "Application of spheroid models to account for aerosol particle nonsphericity in remote sensing of desert dust". Journal of Geophysical Research: Atmospheres 111 (D11). doi:10.1029/2005JD006619.
- ↑ 5.0 5.1 Chen, P.P.-S. (1976). "The entity-relationship model—toward a unified view of data". ACM Transactions on Database Systems 1 (1): 9–36. doi:10.1145/320434.320440.
- ↑ Nakajima, T.; Tonna, G.; Rao, R. et al. (1996). "Use of sky brightness measurements from ground for remote sensing of particulate polydispersions". Applied Optics 35 (15): 2672-86. doi:10.1364/AO.35.002672. PMID 21085415.
- ↑ Dubovik, O.; Lapyonok, T.; Litvinov, P. et al. (19 September 2014). "GRASP: A versatile algorithm for characterizing the atmosphere". SPIE Newsroom. SPIE. doi:10.1117/2.1201408.005558. http://spie.org/newsroom/5558-grasp-a-versatile-algorithm-for-characterizing-the-atmosphere?ArticleID=x109993.
Notes
This presentation is faithful to the original, with only a few minor changes to presentation. Grammar was cleaned up for smoother reading. In some cases important information was missing from the references, and that information was added. The original article lists references alphabetically, but this version—by design—lists them in order of appearance.
