Difference between revisions of "File:Fig6 Antolik FrontInNeuro2018 12.jpg"
Shawndouglas (talk | contribs) |
Shawndouglas (talk | contribs) (Added summary.) |
||
| Line 1: | Line 1: | ||
==Summary== | |||
{{Information | |||
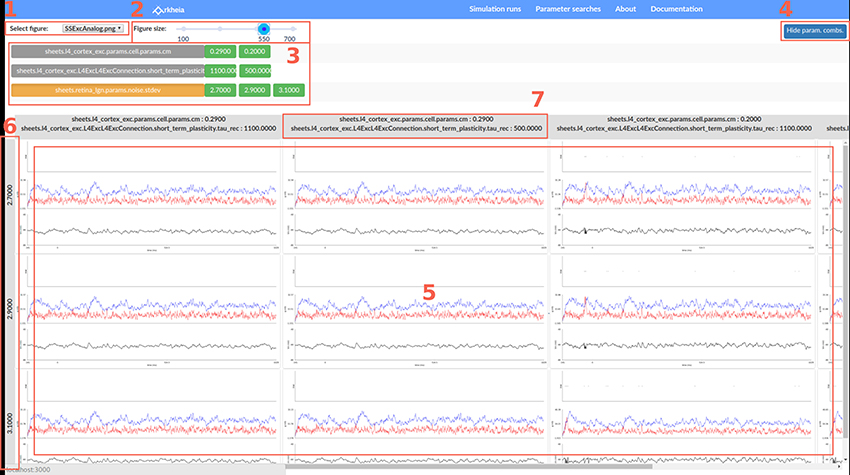
|Description='''Figure 6.''' Interactive parameter search inspection in Arkheia. This page allows users to browse results of a parameter search of a given model. In the top left '''(1)''' the user can pick which of the figure types, generated in each of the simulation runs (i.e., a simulation run for a specific combination of parameters), to explore as a function of parameter values. In the top middle '''(2)''' the user can adjust the size at which the figures will be displayed. Below in the middle panel '''(3)''' is a list of parameters and their values that were explored. Here the user can activate/disable certain parameter values to explore only partial views of the data. The panel '''3''' can be hidden to gain more screen space for the figure grid by clicking button '''(4)'''. The bottom, largest panel of the page contains the grid of figures ('''5'''; filtered based on the selection made in the middle panel) with guides on the left '''(6)''' and top '''(7)''' showing the corresponding parameter combinations. User can scroll through this grid to interactively explore the data. Upon selecting any figure a full-screen version of it will be displayed for rapid detailed inspection. | |||
|Source={{cite journal |title=Arkheia: Data management and communication for open computational neuroscience |journal=Frontiers in Neuroinformatics |author=Antolik, J.; Davison, A.P. |volume=12 |pages=6 |year=2018 |doi=10.3389/fninf.2018.00006}} | |||
|Author=Antolik, J.; Davison, A.P. | |||
|Date=2018 | |||
|Permission=[http://creativecommons.org/licenses/by/4.0/ Creative Commons Attribution 4.0 International] | |||
}} | |||
== Licensing == | == Licensing == | ||
{{cc-by-4.0}} | {{cc-by-4.0}} | ||
Latest revision as of 19:03, 3 April 2018
Summary
| Description |
Figure 6. Interactive parameter search inspection in Arkheia. This page allows users to browse results of a parameter search of a given model. In the top left (1) the user can pick which of the figure types, generated in each of the simulation runs (i.e., a simulation run for a specific combination of parameters), to explore as a function of parameter values. In the top middle (2) the user can adjust the size at which the figures will be displayed. Below in the middle panel (3) is a list of parameters and their values that were explored. Here the user can activate/disable certain parameter values to explore only partial views of the data. The panel 3 can be hidden to gain more screen space for the figure grid by clicking button (4). The bottom, largest panel of the page contains the grid of figures (5; filtered based on the selection made in the middle panel) with guides on the left (6) and top (7) showing the corresponding parameter combinations. User can scroll through this grid to interactively explore the data. Upon selecting any figure a full-screen version of it will be displayed for rapid detailed inspection. |
|---|---|
| Source |
Antolik, J.; Davison, A.P. (2018). "Arkheia: Data management and communication for open computational neuroscience". Frontiers in Neuroinformatics 12: 6. doi:10.3389/fninf.2018.00006. |
| Date |
2018 |
| Author |
Antolik, J.; Davison, A.P. |
| Permission (Reusing this file) |
|
| Other versions |
Licensing
|
|
This work is licensed under the Creative Commons Attribution 4.0 License. |
File history
Click on a date/time to view the file as it appeared at that time.
| Date/Time | Thumbnail | Dimensions | User | Comment | |
|---|---|---|---|---|---|
| current | 19:00, 3 April 2018 |  | 850 × 475 (297 KB) | Shawndouglas (talk | contribs) |
You cannot overwrite this file.
File usage
The following page uses this file:


