Difference between revisions of "File:Fig3 Zehl FrontInNeuro2016 10.jpg"
Shawndouglas (talk | contribs) |
Shawndouglas (talk | contribs) (Added summary.) |
||
| Line 1: | Line 1: | ||
==Summary== | |||
{{Information | |||
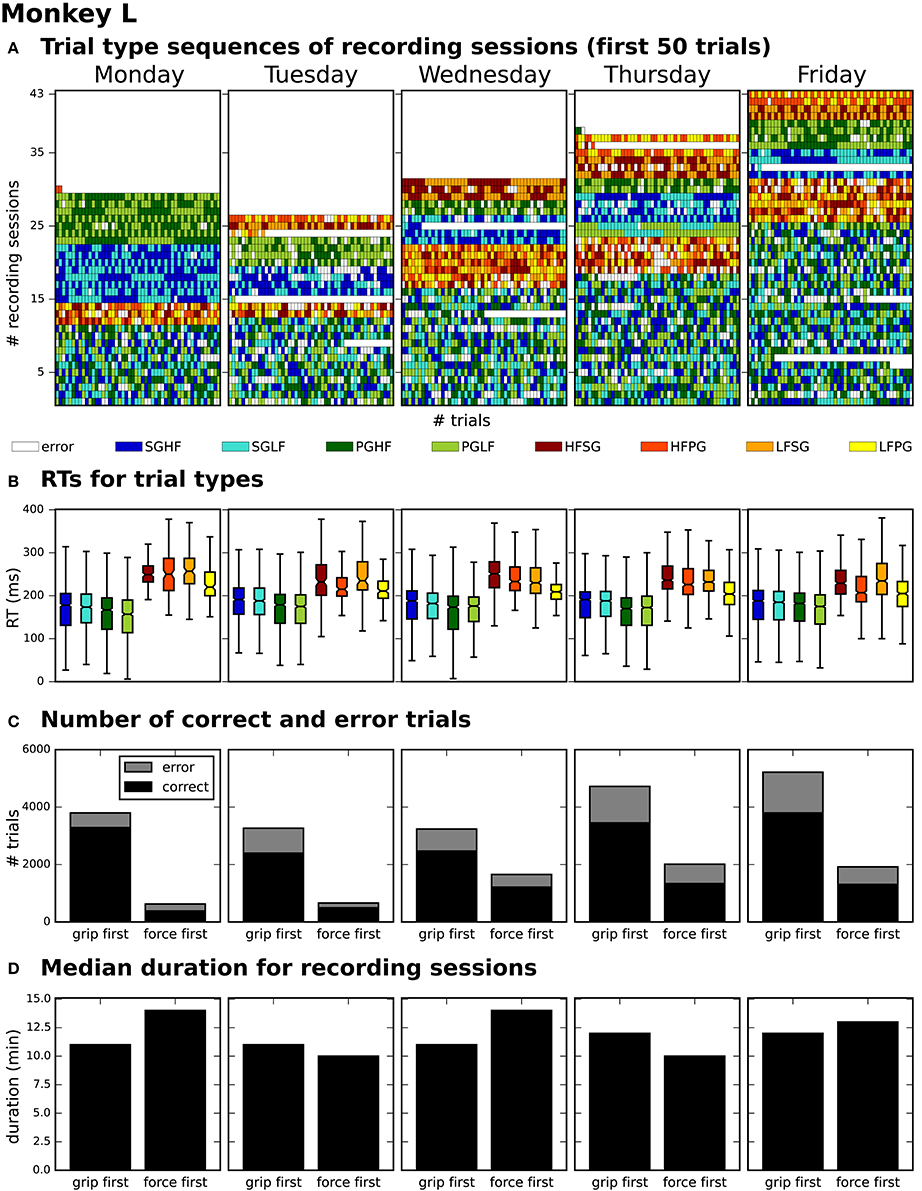
|Description='''Figure 3.''' Overview of reach-to-grasp metadata summarizing the performance of monkey L on each weekday. '''(A)''' displays the order of trial sequences of the first 50 trials (small bars along the x-axis) for each of all sessions (rows along the y-axis) recorded on the corresponding weekday. Each small bar corresponds to a trial and its color to the requested trial type of the trial (see color legend below subplot (A); for trial type acronyms see main text). '''(B)''' summarizes the median reaction times (RTs) for all trials of the same trial type (see color legend) of all sessions recorded on the corresponding weekday. '''(C)''' shows for each weekday the total number of trials of all sessions differentiating between correct and error trials (colored in black and gray) and between sessions where the monkey was first informed about the grip type (grip first) compared to sessions where the first cue informed about the force type (force first). '''(D)''' displays for each weekday the median recording duration of the grip first and force first sessions. | |||
|Source={{cite journal |title=Handling metadata in a neurophysiology laboratory |journal=Frontiers in Neuroinformatics |author=Zehl, L.; Jaillet, F.; Stoewer, A.; Grewe, J.; Sobolev, A.; Wachtler, T.; Brochier, T.G.; Riehle, A.; Denker, M.; Grün, S. |volume=10 |pages=26 |year=2016 |doi=10.3389/fninf.2016.00026}} | |||
|Author=Zehl, L.; Jaillet, F.; Stoewer, A.; Grewe, J.; Sobolev, A.; Wachtler, T.; Brochier, T.G.; Riehle, A.; Denker, M.; Grün, S. | |||
|Date=2016 | |||
|Permission=[http://creativecommons.org/licenses/by/4.0/ Creative Commons Attribution 4.0 International] | |||
}} | |||
== Licensing == | == Licensing == | ||
{{cc-by-4.0}} | {{cc-by-4.0}} | ||
Latest revision as of 00:00, 21 December 2017
Summary
| Description |
Figure 3. Overview of reach-to-grasp metadata summarizing the performance of monkey L on each weekday. (A) displays the order of trial sequences of the first 50 trials (small bars along the x-axis) for each of all sessions (rows along the y-axis) recorded on the corresponding weekday. Each small bar corresponds to a trial and its color to the requested trial type of the trial (see color legend below subplot (A); for trial type acronyms see main text). (B) summarizes the median reaction times (RTs) for all trials of the same trial type (see color legend) of all sessions recorded on the corresponding weekday. (C) shows for each weekday the total number of trials of all sessions differentiating between correct and error trials (colored in black and gray) and between sessions where the monkey was first informed about the grip type (grip first) compared to sessions where the first cue informed about the force type (force first). (D) displays for each weekday the median recording duration of the grip first and force first sessions. |
|---|---|
| Source |
Zehl, L.; Jaillet, F.; Stoewer, A.; Grewe, J.; Sobolev, A.; Wachtler, T.; Brochier, T.G.; Riehle, A.; Denker, M.; Grün, S. (2016). "Handling metadata in a neurophysiology laboratory". Frontiers in Neuroinformatics 10: 26. doi:10.3389/fninf.2016.00026. |
| Date |
2016 |
| Author |
Zehl, L.; Jaillet, F.; Stoewer, A.; Grewe, J.; Sobolev, A.; Wachtler, T.; Brochier, T.G.; Riehle, A.; Denker, M.; Grün, S. |
| Permission (Reusing this file) |
|
| Other versions |
Licensing
|
|
This work is licensed under the Creative Commons Attribution 4.0 License. |
File history
Click on a date/time to view the file as it appeared at that time.
| Date/Time | Thumbnail | Dimensions | User | Comment | |
|---|---|---|---|---|---|
| current | 23:58, 20 December 2017 |  | 922 × 1,191 (791 KB) | Shawndouglas (talk | contribs) |
You cannot overwrite this file.
File usage
The following page uses this file:


