Difference between revisions of "File:Fig7 Lukauskas BMCBioinformatics2016 17-Supp16.gif"
Shawndouglas (talk | contribs) |
Shawndouglas (talk | contribs) (Added summary.) |
||
| Line 1: | Line 1: | ||
==Summary== | |||
{{Information | |||
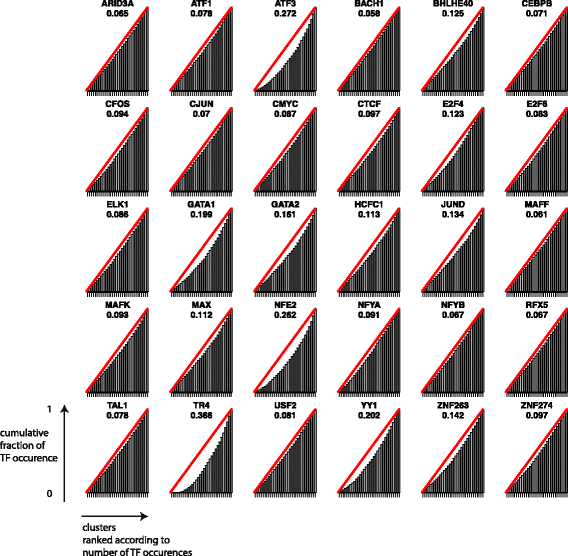
|Description='''Figure 7.''' Cumulative levels of normalized overlap between each TF and the determined clusters. Each sub-plot corresponds to one TF. For each TF, clusters are ranked by their relative overlap with this TF. Each bar corresponds to the cumulative level of normalized overlap between the TF and the considered cluster plus all clusters to the left of it. The null hypothesis of uniform distribution corresponds to the red lines. The area between the red line and the cumulative plots is indicated below the TF name. | |||
|Source={{cite journal |title=DGW: An exploratory data analysis tool for clustering and visualisation of epigenomic marks |journal=BMC Bioinformatics |author=Lukauskas, S.; Visintainer, R.; Sanguinetti, G.; Schweikert, G.B. |volume=17 |issue=Suppl 16 |pages=447 |year=2016 |doi=10.1186/s12859-016-1306-0 |pmid=28105912 |pmc=PMC5249015}} | |||
|Author=Lukauskas, S.; Visintainer, R.; Sanguinetti, G.; Schweikert, G.B. | |||
|Date=2016 | |||
|Permission=[http://creativecommons.org/licenses/by/4.0/ Creative Commons Attribution 4.0 International] | |||
}} | |||
== Licensing == | == Licensing == | ||
{{cc-by-4.0}} | {{cc-by-4.0}} | ||
Latest revision as of 20:39, 31 January 2017
Summary
| Description |
Figure 7. Cumulative levels of normalized overlap between each TF and the determined clusters. Each sub-plot corresponds to one TF. For each TF, clusters are ranked by their relative overlap with this TF. Each bar corresponds to the cumulative level of normalized overlap between the TF and the considered cluster plus all clusters to the left of it. The null hypothesis of uniform distribution corresponds to the red lines. The area between the red line and the cumulative plots is indicated below the TF name. |
|---|---|
| Source |
Lukauskas, S.; Visintainer, R.; Sanguinetti, G.; Schweikert, G.B. (2016). "DGW: An exploratory data analysis tool for clustering and visualisation of epigenomic marks". BMC Bioinformatics 17 (Suppl 16): 447. doi:10.1186/s12859-016-1306-0. PMC PMC5249015. PMID 28105912. https://www.ncbi.nlm.nih.gov/pmc/articles/PMC5249015. |
| Date |
2016 |
| Author |
Lukauskas, S.; Visintainer, R.; Sanguinetti, G.; Schweikert, G.B. |
| Permission (Reusing this file) |
|
| Other versions |
Licensing
|
|
This work is licensed under the Creative Commons Attribution 4.0 License. |
File history
Click on a date/time to view the file as it appeared at that time.
| Date/Time | Thumbnail | Dimensions | User | Comment | |
|---|---|---|---|---|---|
| current | 20:37, 31 January 2017 |  | 568 × 556 (54 KB) | Shawndouglas (talk | contribs) |
You cannot overwrite this file.
File usage
The following page uses this file:


