Difference between revisions of "File:Fig4 Lukauskas BMCBioinformatics2016 17-Supp16.gif"
Shawndouglas (talk | contribs) |
Shawndouglas (talk | contribs) (Added summary.) |
||
| Line 1: | Line 1: | ||
==Summary== | |||
{{Information | |||
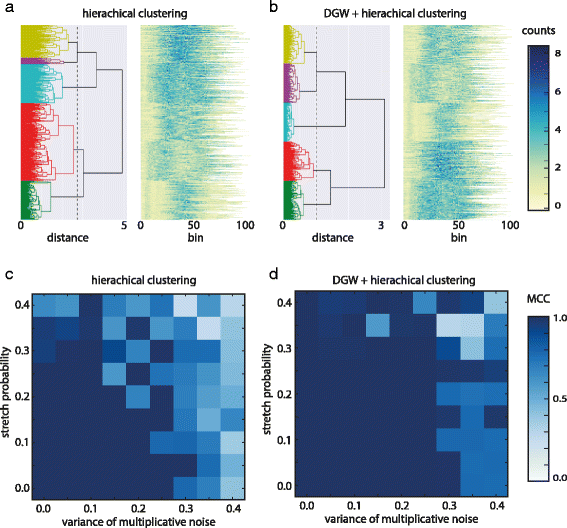
|Description='''Figure 4.''' Simulation results for parameter set (''v'': 0.25, ''p'': 0.25, ''fp'': 0.1). '''a''' Left panel shows the dendrogram of clustered peaks using hierarchical clustering only. Peaks assigned to each of five different cluster are shown in yellow, pink, blue, red and green. X axis represents the pairwise distances '''d''' Right panel shows clustered peaks. Colour coding corresponds to normalized read counts. X axis represents original (unwarped) bins from start of the peaks. '''c''' Matthews Correlation Coefficient for hierarchical clustering based on a set of simulations with varying parameters (''v'', ''p'') and ''fp'' fixed to 0.1. '''b''' and '''d''' as '''a''' and '''c''' but for DGW alignment followed by hierarchical clustering. | |||
|Source={{cite journal |title=DGW: An exploratory data analysis tool for clustering and visualisation of epigenomic marks |journal=BMC Bioinformatics |author=Lukauskas, S.; Visintainer, R.; Sanguinetti, G.; Schweikert, G.B. |volume=17 |issue=Suppl 16 |pages=447 |year=2016 |doi=10.1186/s12859-016-1306-0 |pmid=28105912 |pmc=PMC5249015}} | |||
|Author=Lukauskas, S.; Visintainer, R.; Sanguinetti, G.; Schweikert, G.B. | |||
|Date=2016 | |||
|Permission=[http://creativecommons.org/licenses/by/4.0/ Creative Commons Attribution 4.0 International] | |||
}} | |||
== Licensing == | == Licensing == | ||
{{cc-by-4.0}} | {{cc-by-4.0}} | ||
Latest revision as of 18:53, 31 January 2017
Summary
| Description |
Figure 4. Simulation results for parameter set (v: 0.25, p: 0.25, fp: 0.1). a Left panel shows the dendrogram of clustered peaks using hierarchical clustering only. Peaks assigned to each of five different cluster are shown in yellow, pink, blue, red and green. X axis represents the pairwise distances d Right panel shows clustered peaks. Colour coding corresponds to normalized read counts. X axis represents original (unwarped) bins from start of the peaks. c Matthews Correlation Coefficient for hierarchical clustering based on a set of simulations with varying parameters (v, p) and fp fixed to 0.1. b and d as a and c but for DGW alignment followed by hierarchical clustering. |
|---|---|
| Source |
Lukauskas, S.; Visintainer, R.; Sanguinetti, G.; Schweikert, G.B. (2016). "DGW: An exploratory data analysis tool for clustering and visualisation of epigenomic marks". BMC Bioinformatics 17 (Suppl 16): 447. doi:10.1186/s12859-016-1306-0. PMC PMC5249015. PMID 28105912. https://www.ncbi.nlm.nih.gov/pmc/articles/PMC5249015. |
| Date |
2016 |
| Author |
Lukauskas, S.; Visintainer, R.; Sanguinetti, G.; Schweikert, G.B. |
| Permission (Reusing this file) |
|
| Other versions |
Licensing
|
|
This work is licensed under the Creative Commons Attribution 4.0 License. |
File history
Click on a date/time to view the file as it appeared at that time.
| Date/Time | Thumbnail | Dimensions | User | Comment | |
|---|---|---|---|---|---|
| current | 18:49, 31 January 2017 |  | 567 × 528 (90 KB) | Shawndouglas (talk | contribs) |
You cannot overwrite this file.
File usage
The following page uses this file:


