Difference between revisions of "File:Fig3 Lukauskas BMCBioinformatics2016 17-Supp16.gif"
Shawndouglas (talk | contribs) |
Shawndouglas (talk | contribs) (Added summary.) |
||
| Line 1: | Line 1: | ||
==Summary== | |||
{{Information | |||
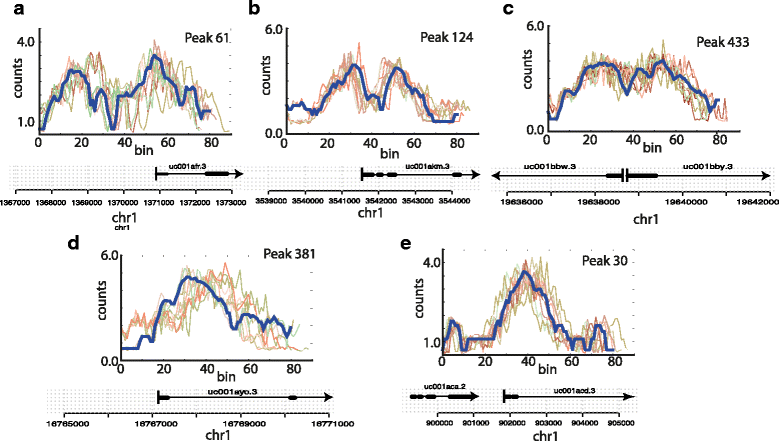
|Description='''Figure 3.''' Generation of simulated data sets: Shown in blue are five seed regions, i.e., original ENCODE H3K4me3 read counts at the start of five known genes. For each of the seed regions we show 10 simulated modifications which are created by multiplying Gaussian noise to each bin (''v'': 0.1), by introducing insertions and deletions (''p'': 0.1) and by flipping the orientation of the peak with probability ''fp'': 0.1. Individual panels ('''a–e''') represent the different seed regions. | |||
|Source={{cite journal |title=DGW: An exploratory data analysis tool for clustering and visualisation of epigenomic marks |journal=BMC Bioinformatics |author=Lukauskas, S.; Visintainer, R.; Sanguinetti, G.; Schweikert, G.B. |volume=17 |issue=Suppl 16 |pages=447 |year=2016 |doi=10.1186/s12859-016-1306-0 |pmid=28105912 |pmc=PMC5249015}} | |||
|Author=Lukauskas, S.; Visintainer, R.; Sanguinetti, G.; Schweikert, G.B. | |||
|Date=2016 | |||
|Permission=[http://creativecommons.org/licenses/by/4.0/ Creative Commons Attribution 4.0 International] | |||
}} | |||
== Licensing == | == Licensing == | ||
{{cc-by-4.0}} | {{cc-by-4.0}} | ||
Latest revision as of 18:32, 31 January 2017
Summary
| Description |
Figure 3. Generation of simulated data sets: Shown in blue are five seed regions, i.e., original ENCODE H3K4me3 read counts at the start of five known genes. For each of the seed regions we show 10 simulated modifications which are created by multiplying Gaussian noise to each bin (v: 0.1), by introducing insertions and deletions (p: 0.1) and by flipping the orientation of the peak with probability fp: 0.1. Individual panels (a–e) represent the different seed regions. |
|---|---|
| Source |
Lukauskas, S.; Visintainer, R.; Sanguinetti, G.; Schweikert, G.B. (2016). "DGW: An exploratory data analysis tool for clustering and visualisation of epigenomic marks". BMC Bioinformatics 17 (Suppl 16): 447. doi:10.1186/s12859-016-1306-0. PMC PMC5249015. PMID 28105912. https://www.ncbi.nlm.nih.gov/pmc/articles/PMC5249015. |
| Date |
2016 |
| Author |
Lukauskas, S.; Visintainer, R.; Sanguinetti, G.; Schweikert, G.B. |
| Permission (Reusing this file) |
|
| Other versions |
Licensing
|
|
This work is licensed under the Creative Commons Attribution 4.0 License. |
File history
Click on a date/time to view the file as it appeared at that time.
| Date/Time | Thumbnail | Dimensions | User | Comment | |
|---|---|---|---|---|---|
| current | 18:30, 31 January 2017 |  | 779 × 441 (61 KB) | Shawndouglas (talk | contribs) |
You cannot overwrite this file.
File usage
The following page uses this file:


