File:Fig8 Brusniak BMCBioinformatics2019 20.png
Original file (1,946 × 1,454 pixels, file size: 1,007 KB, MIME type: image/png)
Summary
| Description |
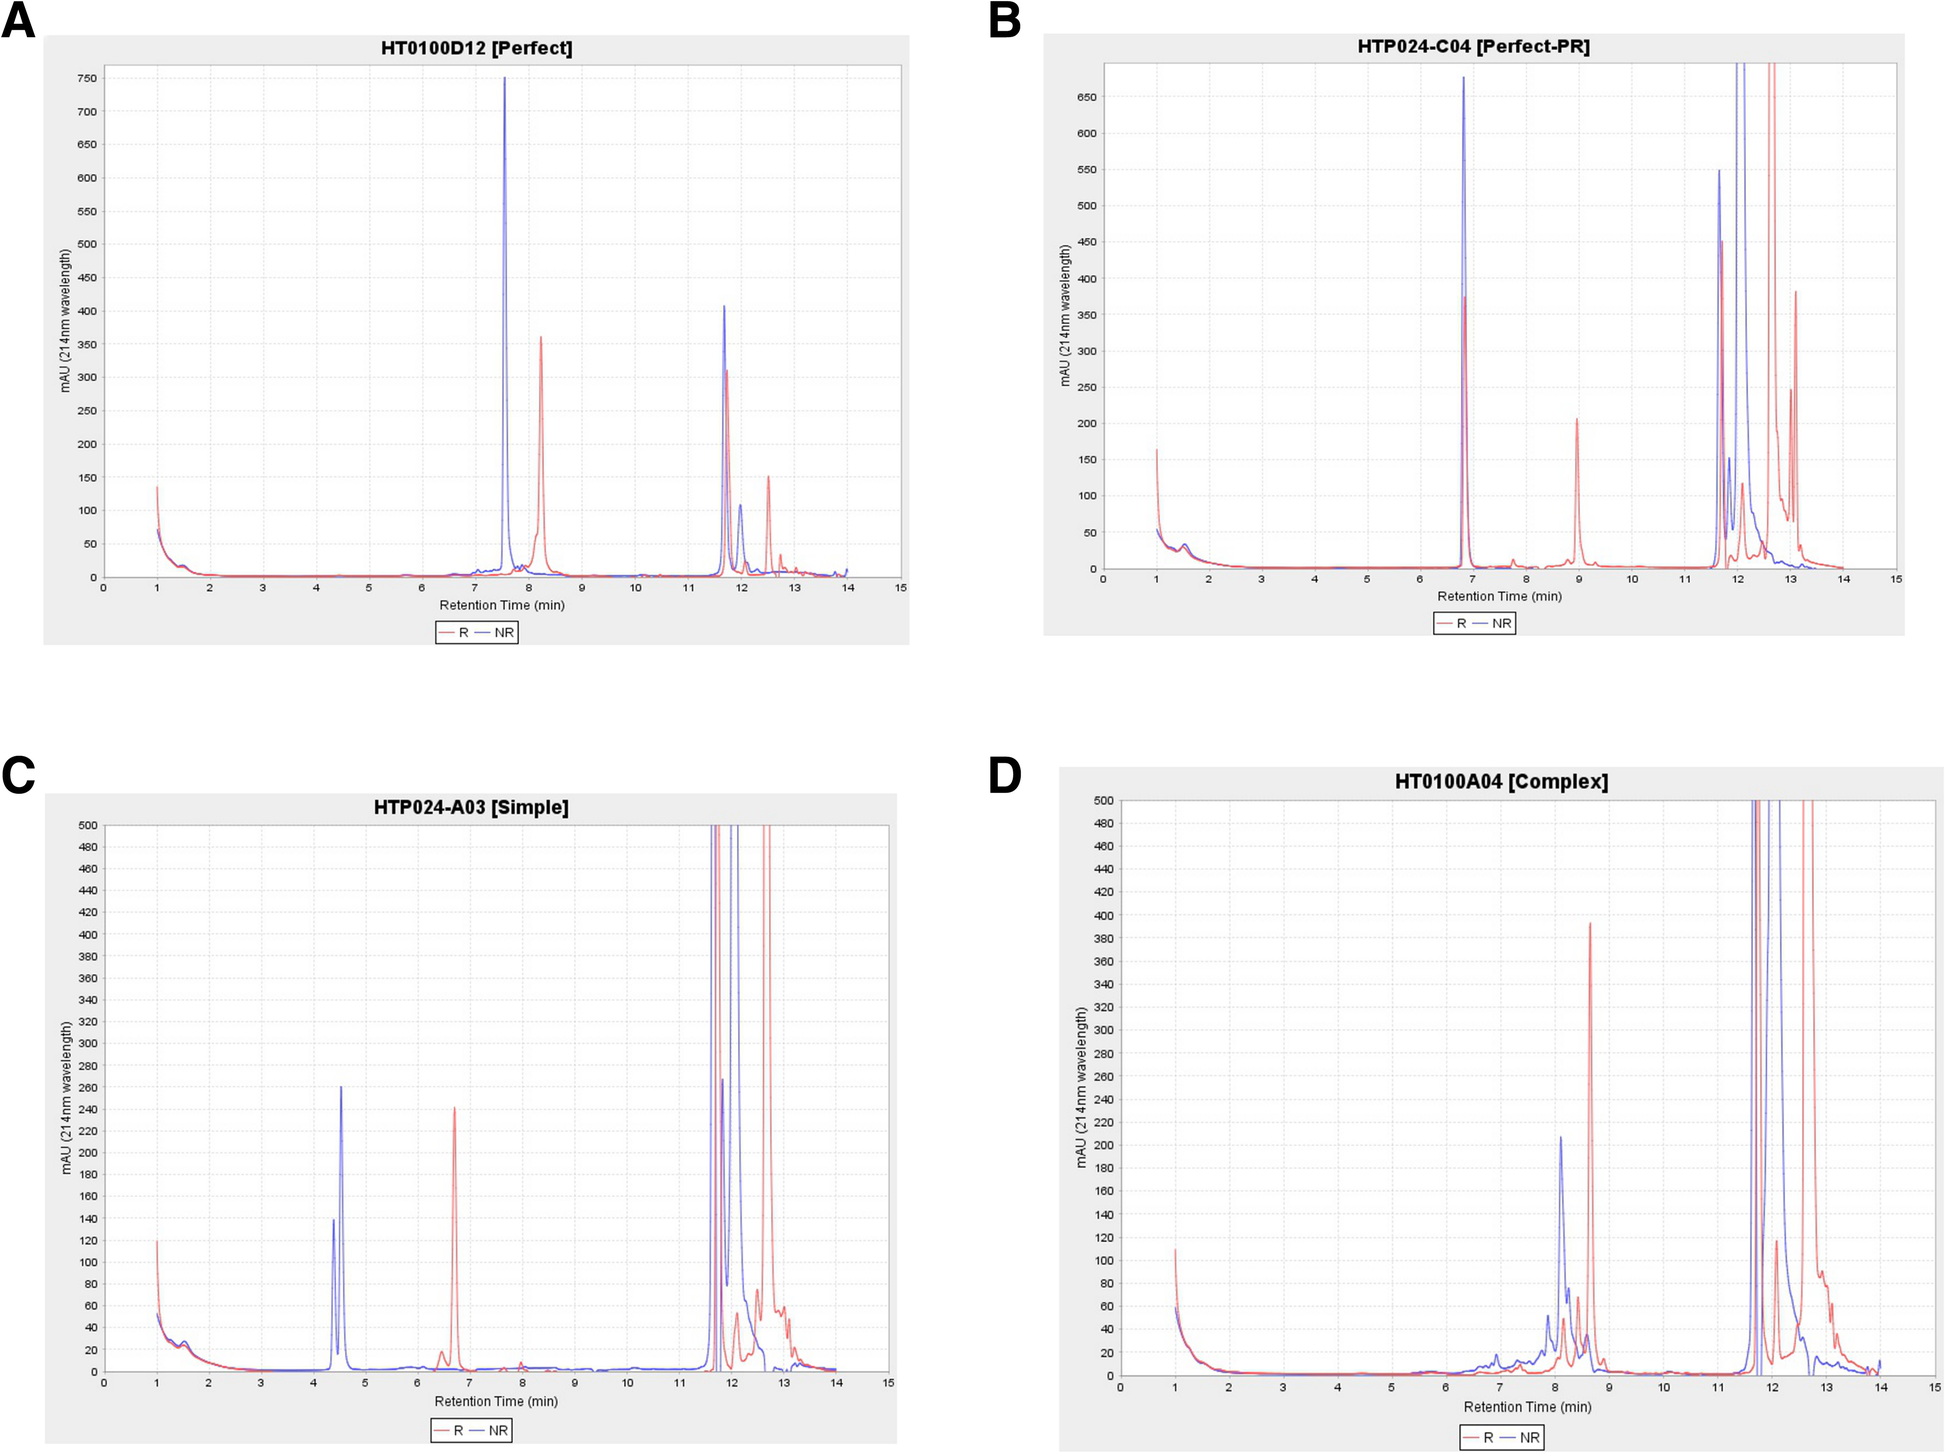
Figure 8. HPLCPeakClassifierApp Classification. The blue trace is from intact protein without DTT treatment and the red trace is from the same protein with DTT treatment. The number of peaks is identified after blank sample normalization provided that the trace is greater than user defined signal-to-noise ratio. (a) Each protein is classified as “Perfect” when there is one blue trace and one shifted red trace that indicates high protein purity with disulfide bond formation. (b) Protein is classified as “Perfect-Partial” when there is a single peak in the blue trace and the red trace has two peaks of which one overlaps with the blue trace, indicating that disulfide bond formation is partially reduced. This type of protein can be of particular therapeutic interest since it shows higher resistance to DTT reduction, which implies that the peptide may remain intact in the typical reductive intracellular environment. (c) Protein is classified as “Simple” when either the blue or red trace has two peaks including shoulder peaks. (d) Protein is classified as “Complex” when either the blue or red trace has more than two peaks. |
|---|---|
| Source |
Brusniak, M.-Y.; Ramos, H.; Lee, B.; Olson, J.M. (2019). "Laboratory information management software for engineered mini-protein therapeutic workflow". BMC Bioinformatics 20: 343. doi:10.1186/s12859-019-2935-x. |
| Date |
2019 |
| Author |
Brusniak, M.-Y.; Ramos, H.; Lee, B.; Olson, J.M. |
| Permission (Reusing this file) |
|
| Other versions |
Licensing
|
|
This work is licensed under the Creative Commons Attribution 4.0 License. |
File history
Click on a date/time to view the file as it appeared at that time.
| Date/Time | Thumbnail | Dimensions | User | Comment | |
|---|---|---|---|---|---|
| current | 22:35, 24 June 2019 | | 1,946 × 1,454 (1,007 KB) | Shawndouglas (talk | contribs) |
You cannot overwrite this file.
File usage
The following page uses this file:


