File:Fig3 Karaattuthazhathu NatJLabMed23 12-2.png
Original file (698 × 679 pixels, file size: 109 KB, MIME type: image/png)
Summary
| Description |
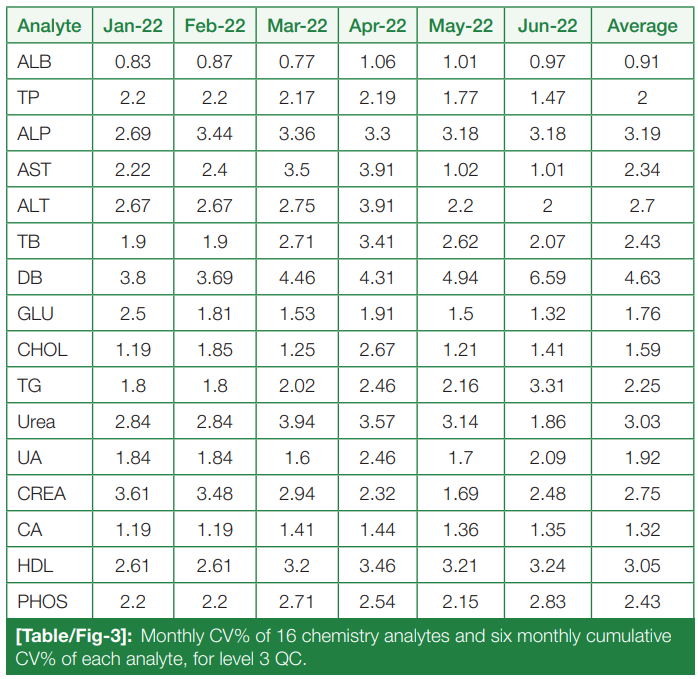
Table/Fig. 3 Monthly CV% of 16 chemistry analytes and six-month cumulative CV% of each analyte, for level 3 QC. CV: Coefficient of variation; ALB: Albumin, TP: Total protein; ALP: Alkaline phosphatase; AST: Aspartate transaminase; ALT: Alanine transaminase; TB: Total bilirubin; DB: Direct bilirubin; GLU: Glucose, CHOL: Cholesterol; TG: Triglycerides; UA: Uric acid; CREA: creatinine; CA: Calcium; HDL: High-density lipoprotein; PHOS: Phosphorus. |
|---|---|
| Source |
Karaattuthazhathu, Anupapama R.; Sathi, P.P.; Nair, Lathi; Ramees, P.M.; Manayani, Reenu; Benny, Elizabeth; Benny, Mary (2023). "Sigma metrics as a valuable tool for effective analytical performance and quality control planning in the clinical laboratory: A retrospective study". National Journal of Laboratory Medicine 12 (2): PO14 - PO18. doi:10.7860/NJLM/2023/60440.2714. |
| Date |
2023 |
| Author |
Karaattuthazhathu, Anupapama R.; Sathi, P.P.; Nair, Lathi; Ramees, P.M.; Manayani, Reenu; Benny, Elizabeth; Benny, Mary |
| Permission (Reusing this file) |
Creative Commons Attribution-NonCommercial-NoDerivs 4.0 International |
| Other versions |
Licensing
|
|
This work is licensed under the Creative Commons Attribution-NonCommercial-NoDerivatives 4.0 International License. |
File history
Click on a date/time to view the file as it appeared at that time.
| Date/Time | Thumbnail | Dimensions | User | Comment | |
|---|---|---|---|---|---|
| current | 01:36, 14 February 2024 | | 698 × 679 (109 KB) | Shawndouglas (talk | contribs) |
You cannot overwrite this file.
File usage
The following page uses this file:


