File:Fig1 Dufresnes PLOSONE2018 12-1.png
Original file (2,272 × 2,712 pixels, file size: 321 KB, MIME type: image/png)
Summary
| Description |
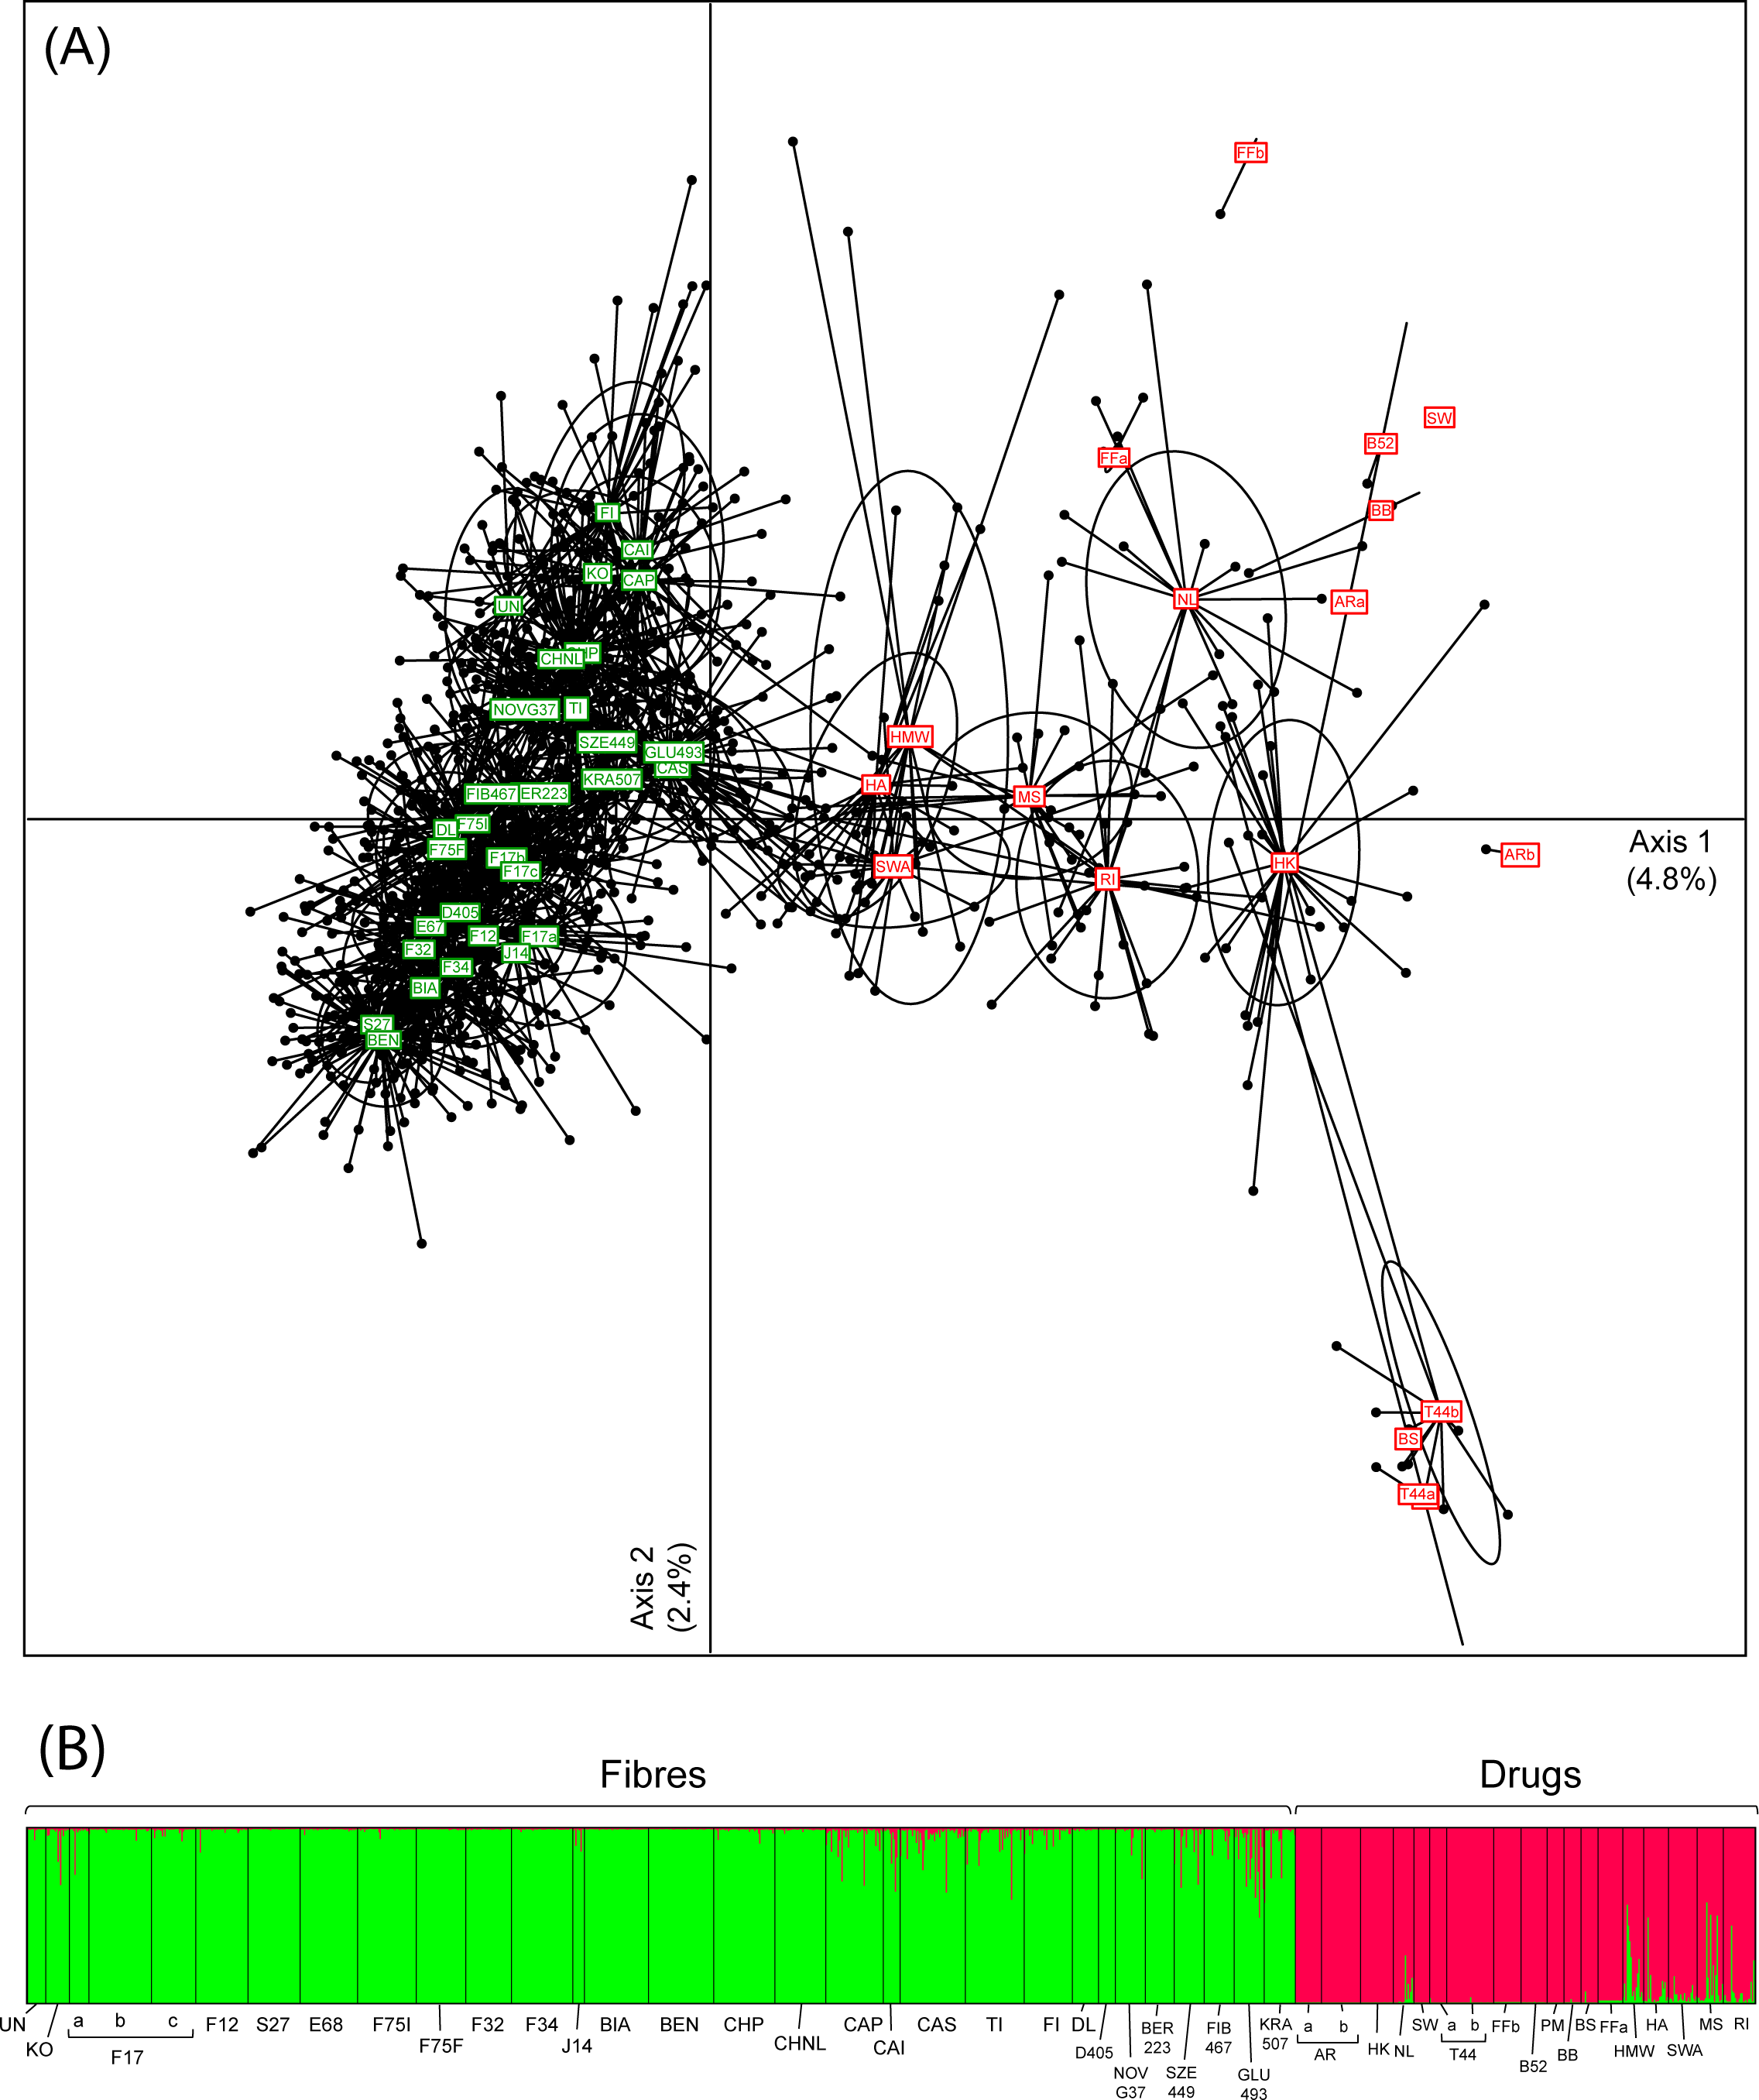
Figure 1. Principal component analysis (A) and Bayesian clustering with STRUCTURE (B) of individual genotypes from 48 Cannabis accessions. Fiber and drug accessions are displayed in green and red respectively on the PCA. Ellipses illustrate 80% inertia of each accessions. Dots represent individuals, linked to their accessions (labelled within colored squares). On the STRUCTURE barplots, colors show the probability of assignment to each cluster (K = 2), perfectly distinguishing fibers from drugs. |
|---|---|
| Source |
Dufresnes, C.; Jan, C.; Bienert, F.; Goudet, J.; Fumagalli, L. (2017). "Broad-scale genetic diversity of Cannabis for forensic applications". PLOS ONE 12 (1): e0170522. doi:10.1371/journal.pone.0170522. |
| Date |
2017 |
| Author |
Dufresnes, C.; Jan, C.; Bienert, F.; Goudet, J.; Fumagalli, L. |
| Permission (Reusing this file) |
|
| Other versions |
Licensing
|
|
This work is licensed under the Creative Commons Attribution 4.0 License. |
File history
Click on a date/time to view the file as it appeared at that time.
| Date/Time | Thumbnail | Dimensions | User | Comment | |
|---|---|---|---|---|---|
| current | 20:51, 10 April 2018 | | 2,272 × 2,712 (321 KB) | Shawndouglas (talk | contribs) |
You cannot overwrite this file.
File usage
The following 2 pages use this file:


